

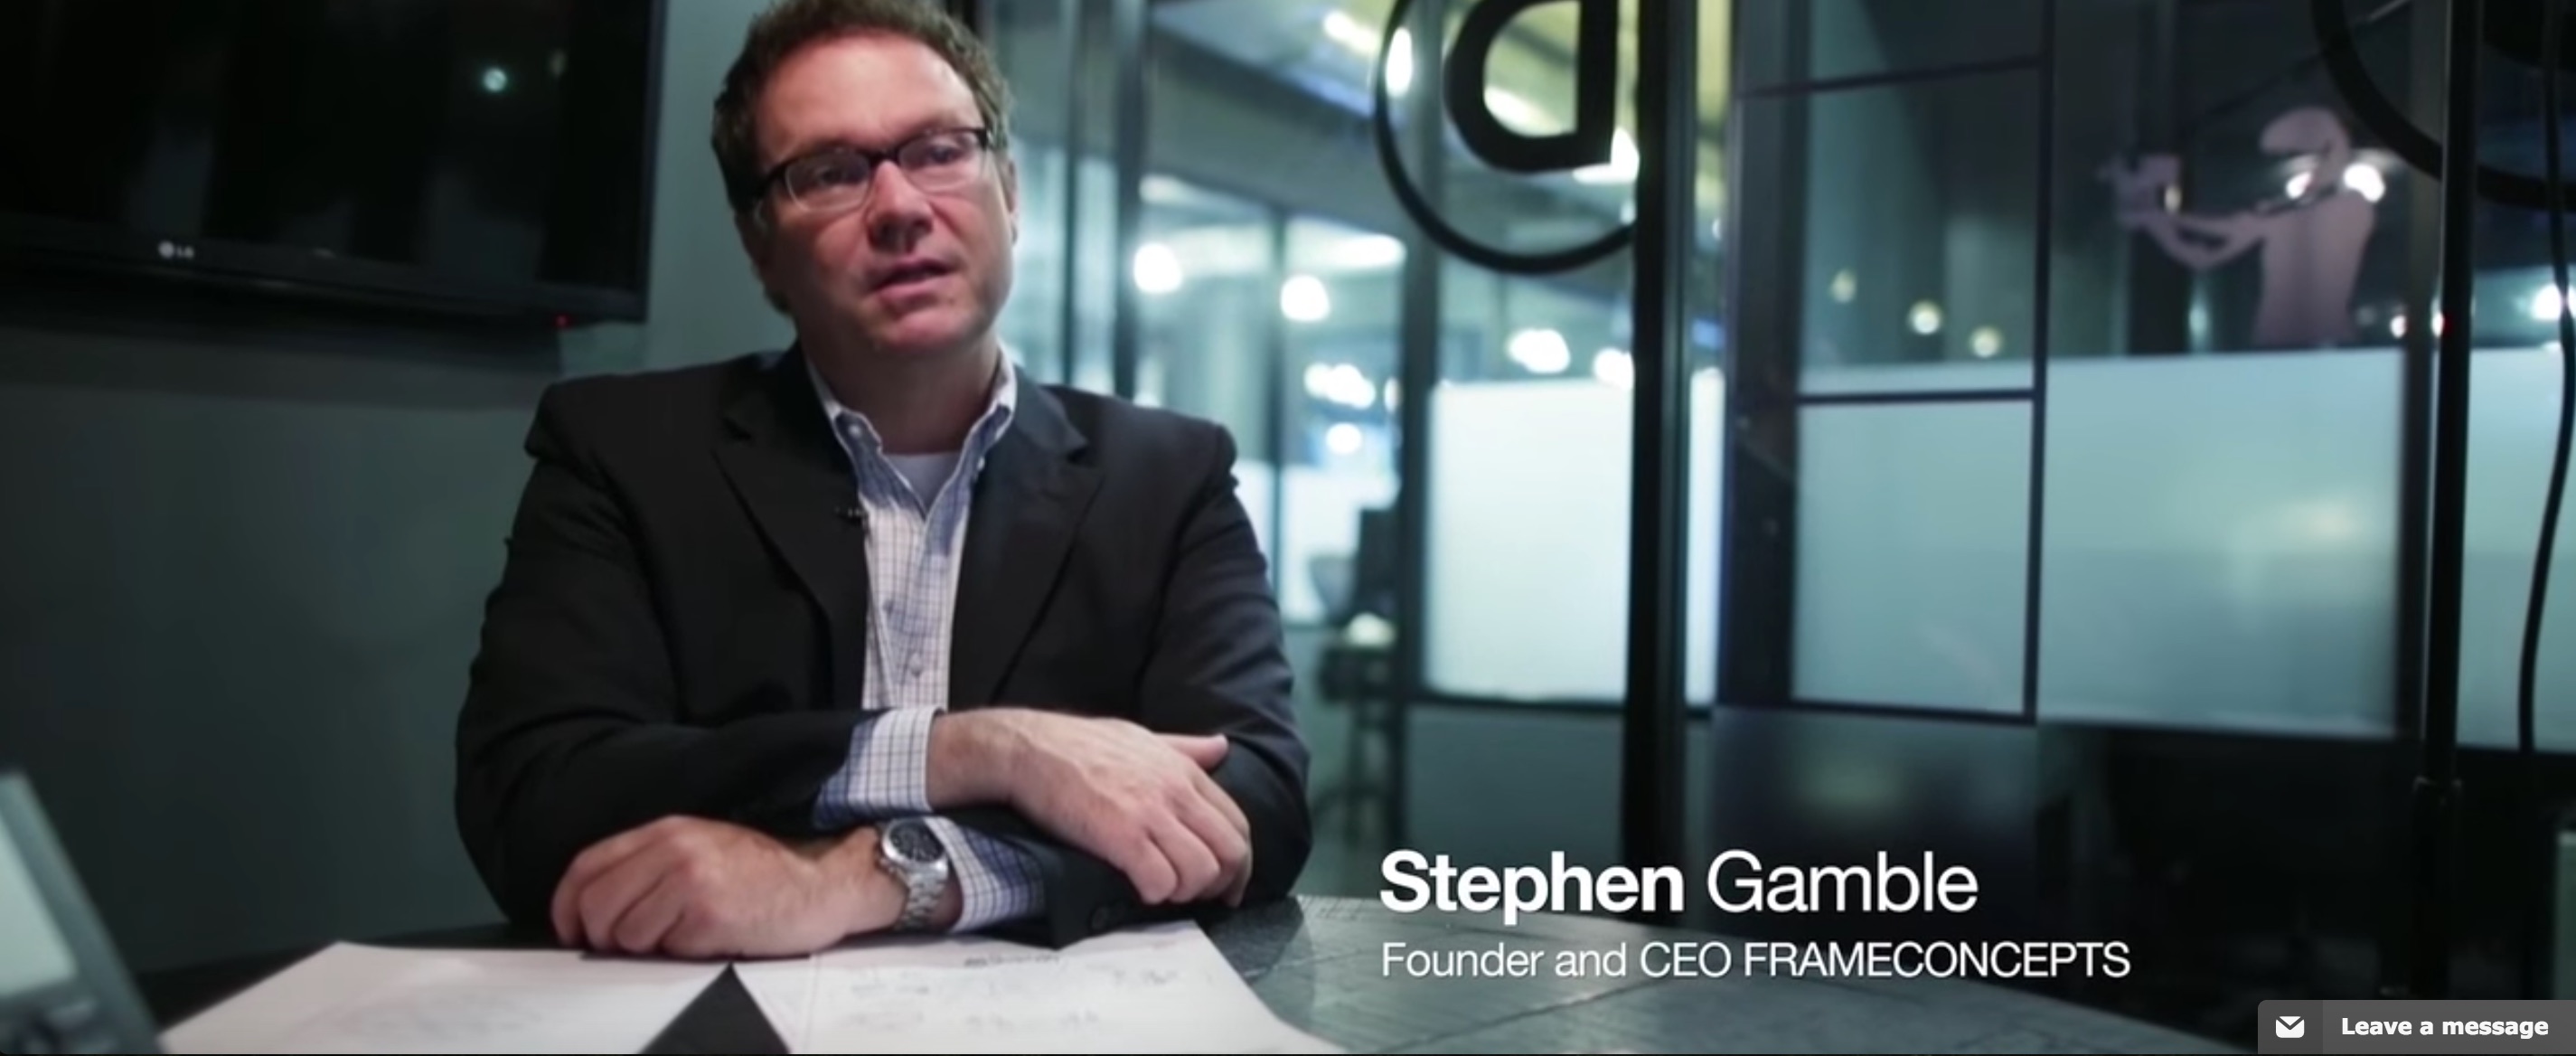
About the Author: Stephen Gamble
Stephen Gamble is the Founder and CEO of Frame Concepts, a visual solutions company that provides business-driven visual solutions to enable understanding and engagement. Mr. Gamble has spent over 20 years on the client side with corporations such as IBM, Bear Stearns, Exxon and a whole host of innovative start-ups to engage their marketplace, management and stakeholders. He formed Frame Concepts to provide visual-centric solutions for every business function and application. Contact Stephen today to request a demonstration.
