

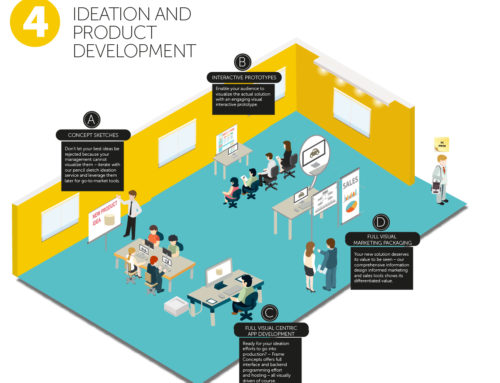
Infographics are Not the Whole Visual Story

This is an infographic series content program (not a solution pictogram)
Visuals help business engage with their audience. And while the mighty infographic seems to come to mind over the last year or two as the paradigm of visual explanation, we here at Frame have helped businesses with a wide array of visual solution types including the mighty infographic. In my first meeting with a prospective client, I sometimes have a sense that they may feel that I am splitting hairs with our visual solution distinctions (i.e.” ok whatever, you are basically talking infographics, right? – type thing) but the distinctions, after years of tackling some of the most challenge business communication problems, has proved to be not trite and represent guttural differences with categorically different business purposes. Any business wanting to become visually-centric in their communication approach (and I suggest they do) would be well advised to think about their strategy with the following categories of visual solution types at their disposal.
Content Marketing vs Positioning and Solution Marketing
One core visual solution distinction runs across content and solution marketing. This very meaningful distinction is less about the visual craft that goes into them and more about the marketing purpose. A little background …in my marketing career spent mostly on the client side before Frame, I had the privilege of overseeing both content or as we called it back then editorial or PR and the solution marketing function. On the content marketing, I could be accused of putting too much “sell” into the editorial where the journalists wanted to bring the story out or as they put it – the narrative out of the piece at hand. And on the flip side, when focussing on product marketing I could be too concerned on case study type stories when the explicit point and value of the offering needed to be explained. Anyone who has run these two functions will know that while both have content at the bottom of them – the content marketing programs feeding email (or marketing automation) and social and PR channels are more timely and have less of a shelf life because of that fact. While the solution or product marketing is aimed at positioning and highlighting the differentiated value the solution has for a segmented audience. If you do your job right with solution marketing and the solution or marketplace does not change too radically, then the product marketing content could have a shelf life of a few years as opposed to a few months (even weeks) for the content marketing programs.

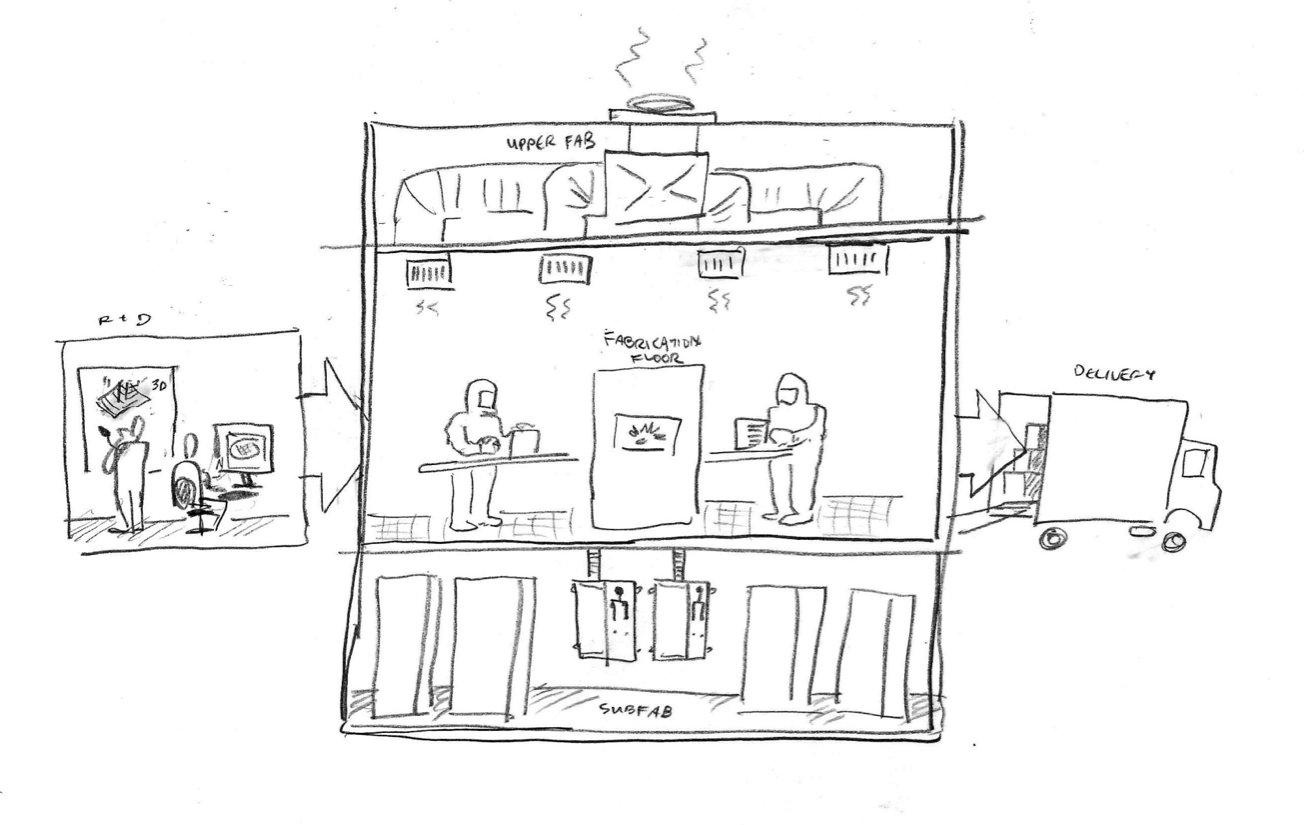
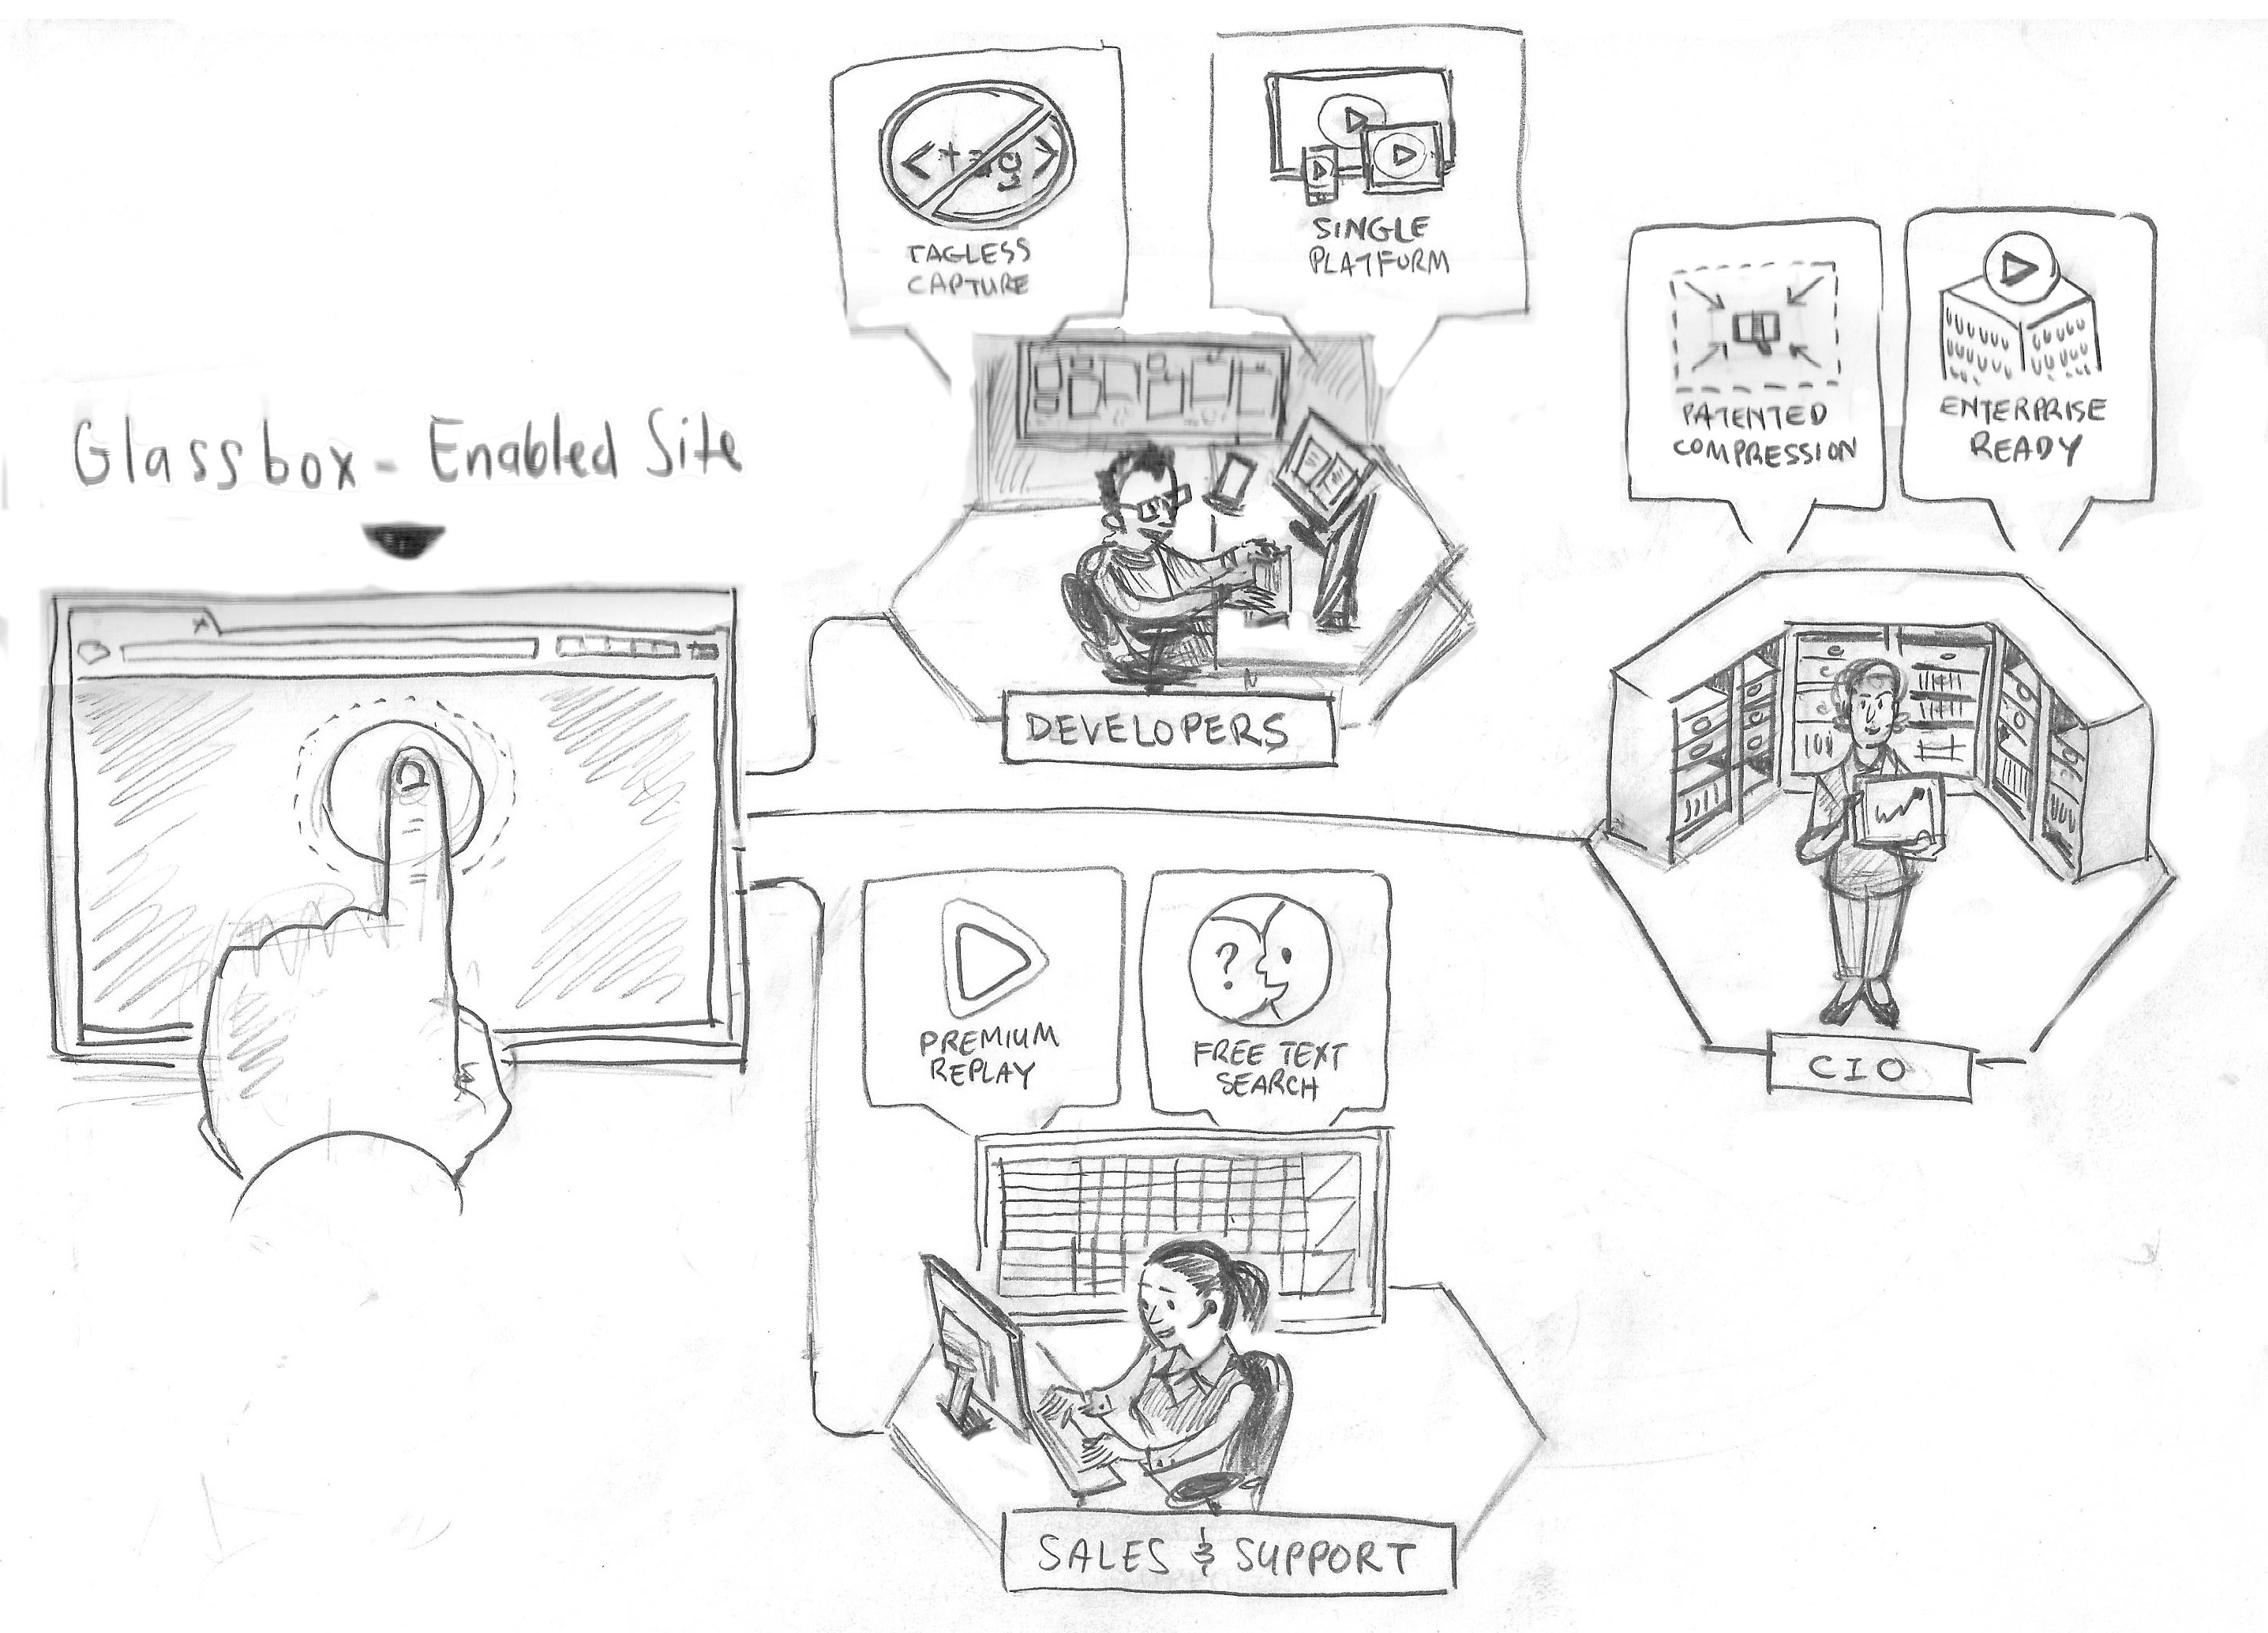
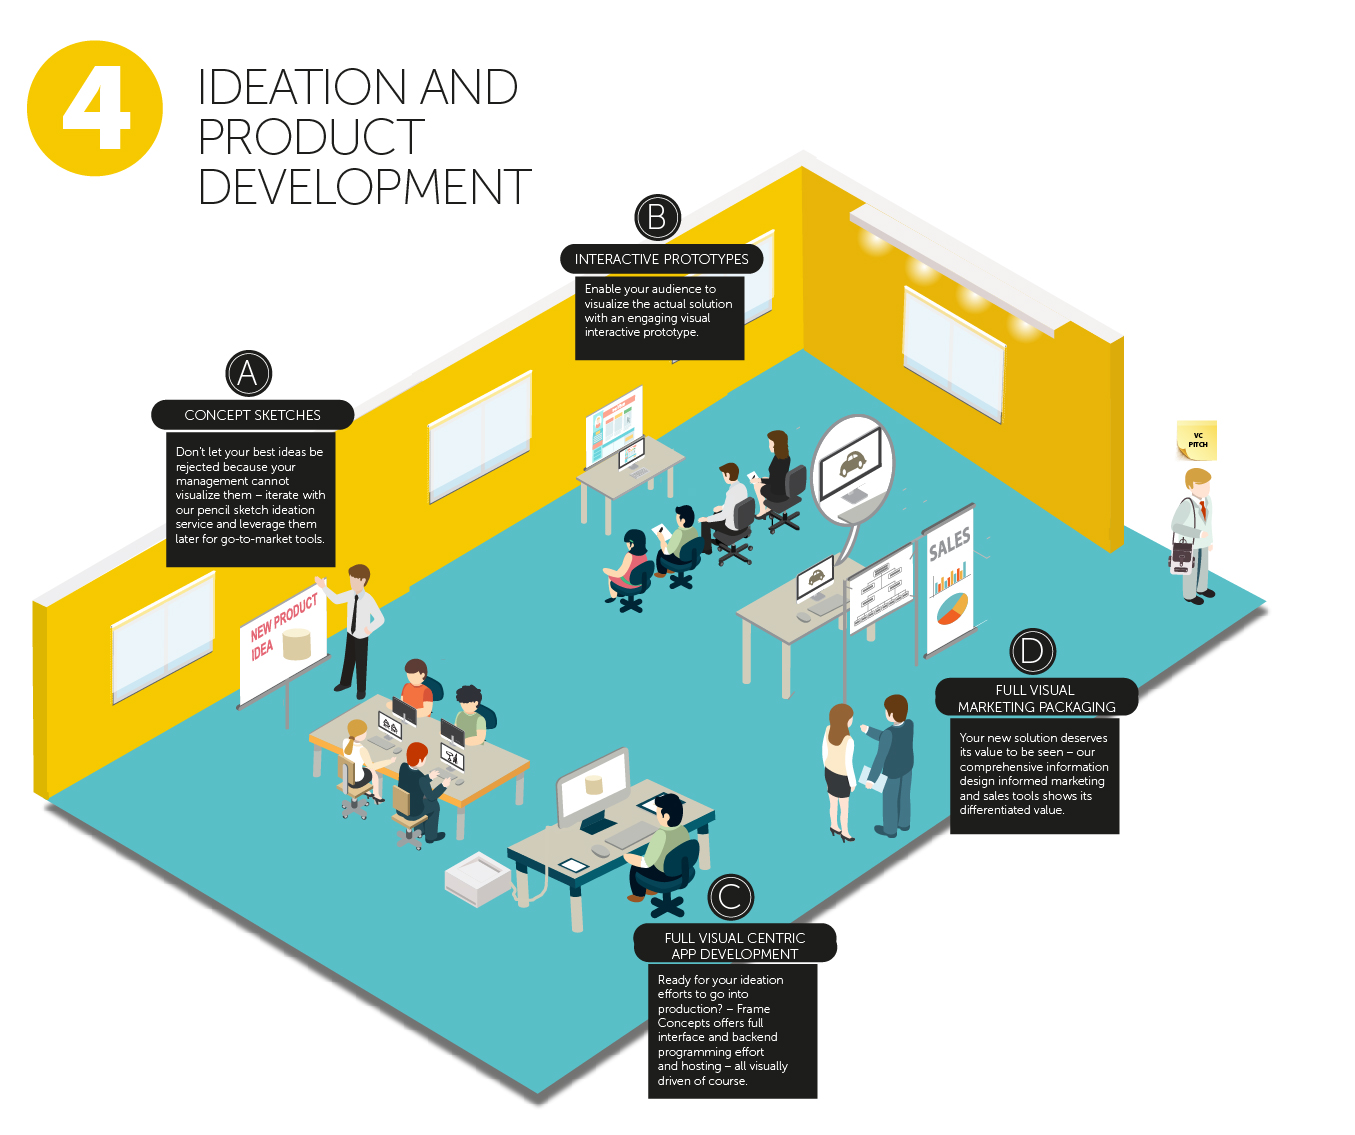
And here is a solution pictogram
Infographics Equals Content Marketing and Pictograms Equals Solution Marketing
So on the solution marketing side we spend a lot more time up front appreciating the nuances of our client’s offerings and how offers unique value to its relevant marketplace segments. And we typically (not always as this is a creative solution and approach) use a 3D render – an isometric sensibility – so the viewer feels pulled into the context of the solution and can see how their function would receive the benefit of that solution. We use the popular infographic – we call it the 2D infographic – with stick people, icons, large fonts and numbers and visual narrative to pull the viewer into that narrative to get them to that ah-hah moment. But its typically expressing a point of view and an explicit solution-sell – more focussed on things like tips and tricks, a top list of some sort, best practices or some recent provocative research. And the 2D infographics are also very visually engaging and intuitive and … well … cool. But as cool as they are, if the footnote or even heading suggests fresh off the presses on March 2011 (writing this post on March 2014) then the engagement is not going to be there. But thats why we do infographic content series to keep watering the garden and growing the social community and subscriber base and engagement and connect them back to our client websites where they might notice the more explicit solution pictogram and get pulled in. Get so pulled in that they want that free demo or consultation. Thats the two-legged visual approach that our clients have so much success with.
The One-Two Punch
So our clients are constantly coming to us telling us that their website or sales presentation or product demo is not converting. So we visualize their offering in the form of a pictogram so their audience can quickly come to terms with the point of the offering for them and more importantly their value. But you do not convince everyone on one visit so you need to bring your marketplace back to drink in the form of engaging content that we serve up with infographics that can be placed on our client’s blogs or via email or links on their social sites. And when they click on the engaging infographic from the content program they are brought back to our client’s site where again they see the engaging pictogram and they quickly realize that their is a solution that is speaking to some of the concerns raised in the infographic series. And thats how your bring your marketplace in visually.

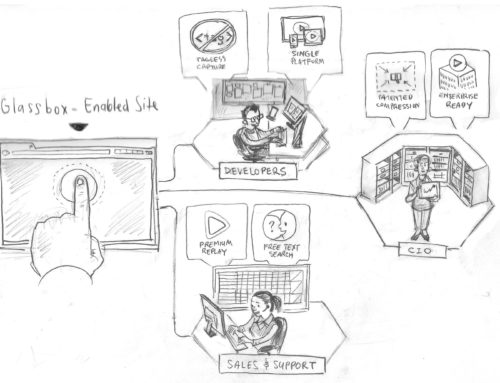
This is an infographic borrowing a bit of visual sensibility from the pictogram.
Visual Semantics or a Powerful Combination?
So it is just infographics. No not really. They need to become aware of you and appreciate your point of view, receive some relevant and timely information in a visually engaging way and respect your nuance knowledge in their practice area and then – they need to see the point of your offering and whether it offers the particular value they need. And that is through the solution pictogram. We have clients that only do infographics or infographic programs with us and we have clients that only do solution pictograms. And they make dramatic improvements with either. But I wish they would all integrate them together – pictogram and infographic – to dominate their marketplace. If I was their head of marketing, that would be the only way I would do it.
I am going to carry on with these visual solution distinctions in a bit of a series – next topic – Icons vs Illustrations.
If you would like a demonstration and a free consultation on our infographic content programs and solution pictograms, click here – Free Demo and Consultation.

