Having come face-to-face with a myriad of business communication problems with a myriad of professional functions in all shapes and sizes of each major industry from startups to Fortune 500 – we have a unique perspective. And there is a community of us “Framians” (we just made that up) that share this common concern to get our audiences into the correct conceptual framework – whether its during a sale presentation, a webinar, a live event, presenting research or setting up a web portal loaded with big data. And we all think the best tool to help your audience visualize the point is in fact visuals.
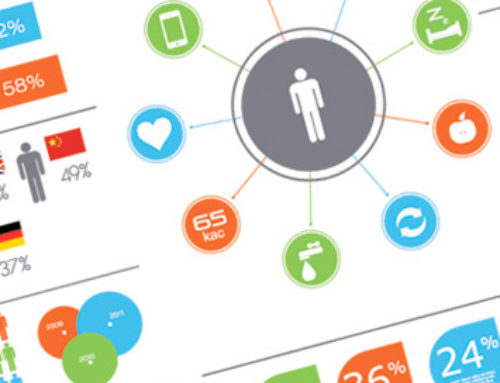
The following series presents our thoughts on the craft of applying visuals to business and technical problems to drive understanding and engagement. A meta-infographic series on infographics if you will.
You can subscribe to get your monthly free infographic on all things visual and business challenges by completing the short form on the right hand side.


