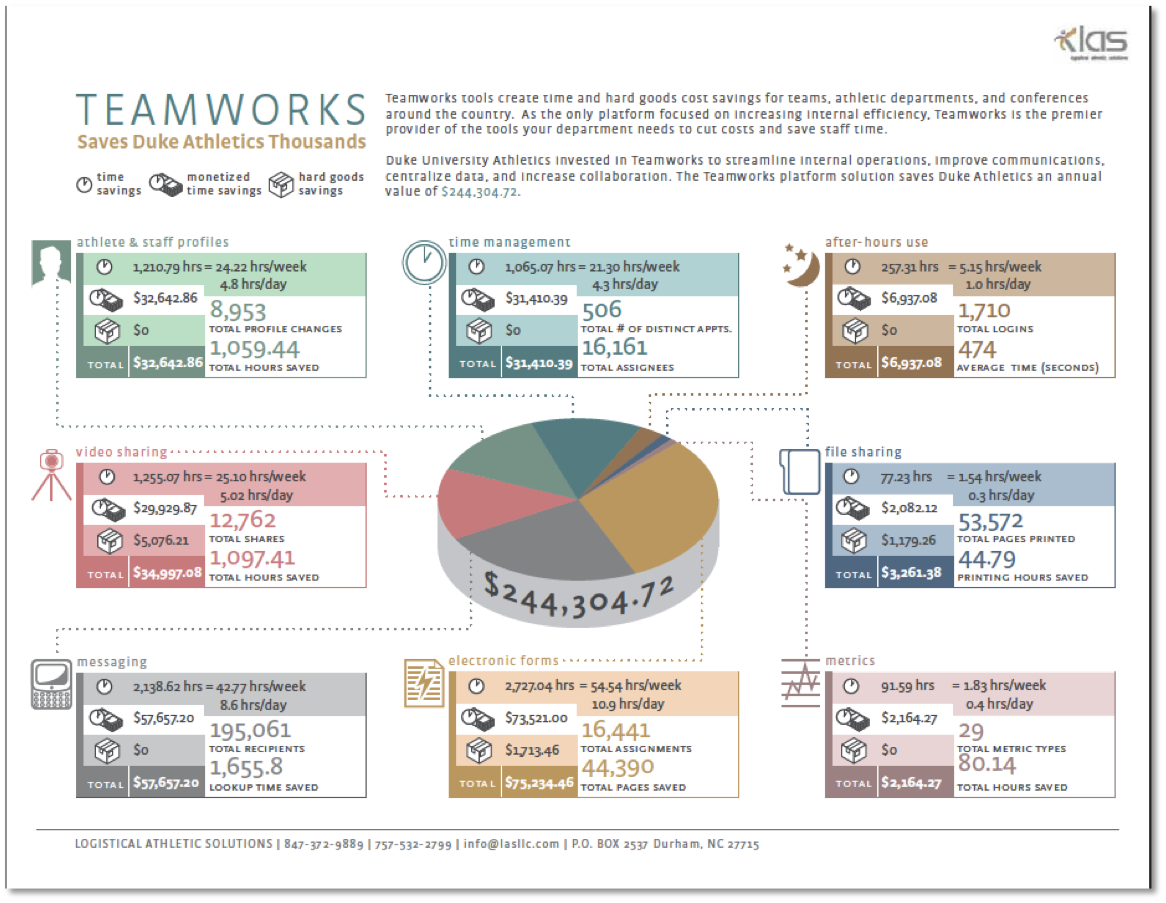
Client wanted to stop financial nay-sayers in the sales cycle by clearly visually communicating each of the significant categories of return on investment with an ROI Infographic.

Client wanted to stop financial nay-sayers in the sales cycle by clearly visually communicating each of the significant categories of return on investment with an ROI Infographic.
