

Visual Solutions and Argumentation – Recap
Well we left off last week talking about the need to weave an argument into the visual narrative and after going through a quick memory lane trip of this author’s teaching critical thinking as a college philosophy instructor we turned to the argument by analogy. Given the visual nature of our craft here at Frame Concepts, its not only tempting to embed analogies but it is highly effective at bring the complex into the everyday.
But there are two other basic argument types we leverage – empirical and deductive.
Lets Turn to Empirical Type Arguments
When we say “empirical” we are simply saying that the argument will leverage data as evidence to substantiate the claims being made with the visual communication solution. And on a guttural level its very effective as it answers the nay-sayer who reacts – “I’ll believe it when I see it.” And by offering verifiable evidence, you are effectively making them “see” it and so believing it. Given science has adopted the empirical model (well maybe with a bit of deduction and statistical modeling), it is tempting to think that is the only method but their are purely logical or deductive arguments (and we will look at those in the next post). And certainly one does not have to turn to the academic science journals to see the empirical method or argumentation – one can simply go to the television any given day or evening and see the abundance of empirical argumentation for the latest cleaning product or cold remedy or car tires.
But Empirical Evidence or Data-Driven Arguments Present a Problem 
Like our political leaders like to remind us or rather the analysts covering them – you can find data to defend and position and any candidates record. And in the data-driven frenzy for every new innovative offering in the complex consultative b2b solution world – this is also true. It seems that every solution uses data to defend its supposed leadership position. So now the problem becomes – how do I hit my audience on the head (in the most professional way possible of course), that my solution is unique – it delivers on the RELEVANT metrics.
Visualization Can Help

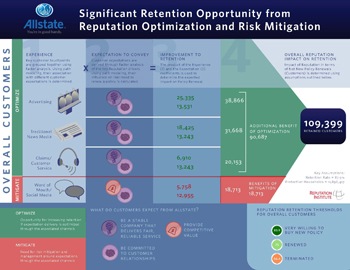
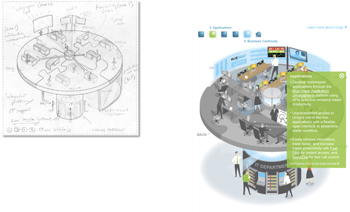
So lets turn the empirical argument now to the topic of visual solution delivery. In the deluge of data (we all heard about big data in 2013 right?), rather than leverage a highly conceptual, illustrative piece pinned on a metaphor or analogy, one lets the numbers do the talking. And data visualization as a craft has come a long way. One can simply and literally let the numbers do the talking as this highly number drive infographic piece on impressive metrics for an Insurance Brokers Association on the right hand side.
Some More Evidence Based Visual Solutions
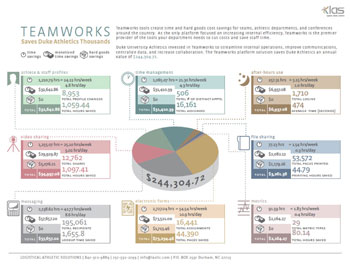
Clever use of iconography tied to real return on investment numbers for this software platform focussed on college athletic departments.
Turning Data Driven Arguments Into Client Dashboards
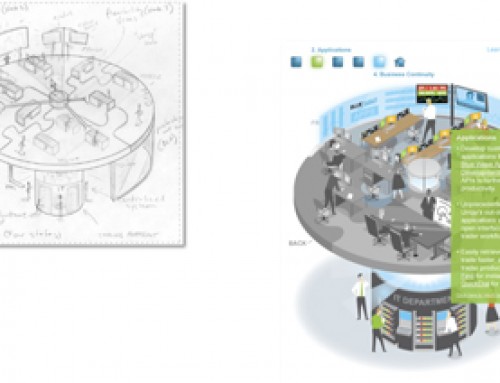
Even when you sell and close a client based on impressive empirical argumentation that you can deliver on the key value points and metrics they need to drive their business, clients can forget. If any of you had quarterly reviews with your clients with the tone of the meeting being “what have you done for me lately”, its important to remind them that you are constantly delivering measurable value (assuming you want them to renew your contract). In this sample we create a visual dashboard showing for a reputation consultancy (yes they exist) showing ongoing findings and recommending corrective actions in these visual dashboards.
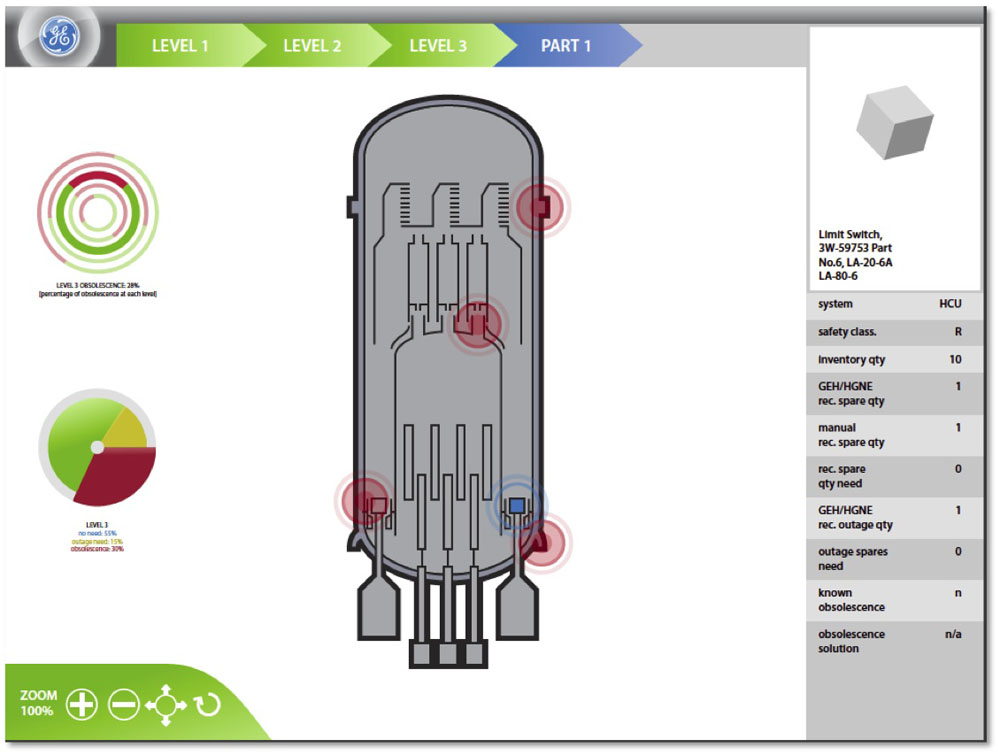
And Now for Something a Bit More Serious – Nuclear Parts Data Visualization
Far from a marketing positioning argument, a Fortune 500 Nuclear Energy Division needed to convey to its nuclear clients in an intuitive, compelling and actionable way what exactly is the spare parts status for their nuclear reactors and control rooms. So the empirical evidence (remember we are talking about empirical arguments in today’s post) that there is in fact a problem is that actual inventory which may not be in sufficient quantity or obsolete with or without a known engineering solution. A very serious issue – and to explain (far from an argument I suppose) where these issues are, Frame came up with an elegant solution – pulsating red dots. These dots are connected to the database and show exactly where as you drill down in the nuclear reactor and control room is the area of concern.
So Is Empirical the Only Way to Go?
Verifiable data-based empirical argumentation is very powerful. But sometimes to get your audience over the hump they need to be able to see how logically you approach makes sense. If I could offer the entire Barnes and Noble catalog from the convenience of your home, would that not logically meet your needs (I worked in an early ecommerce software startup in the late 90s’). Sometimes logical or deductive argumentation is the way to go and these type of arguments require a different visual approach as we shall see in our next blog post.
While You Are Waiting for the Next Post on Deductive Arguments …
If you would like a live demo and a free consultation to discuss what visual solution might be best for your business goals, click here – Free Demo and Consultation.


