

Trend: Infographics – Helping Marketers Cut Through The Clutter
 Marketing in the 21st century has become immensely complex due to channel fragmentation and an avalanche of data creation. On any given day, Internet users will create 1.5 billion pieces of content on Facebook, tweet 140 million times on Twitter and upload 2 million videos to YouTube. According to a joint study conducted by IDC and EMC, it is estimated that the general public will create 1.8 zettabytes of data in 2011, with that number expected to double within the next two years. To put 1.8 zettabytes into perspective, the number is equivalent to 200 billion high definition movies each 120 minutes long. These new data complexities are the result of convoluted digital relationships, advances in scientific discoveries and the speed of new media.
More importantly, human comprehension of this data can only be done visually. According to Google Trends, the term “infographic” was virtually nonexistent on the web in 2009 yet has grown exponentially to over 10 million mentions in June of this year.
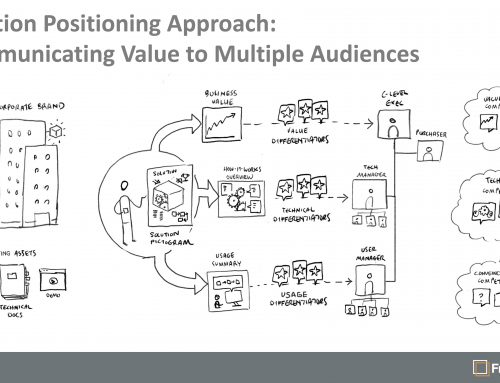
Takeaway: Visual Explanations Are Needed Now More Than Ever
If you’re marketing anything that takes more than five seconds to explain, you will need to make a serious investment in your visual displays. This rings true even more for B2B marketers, as many product benefits are latent and situation specific. The growth in infographics also demonstrates consumer interest in education and their desire to understand complex concepts that shape their world.
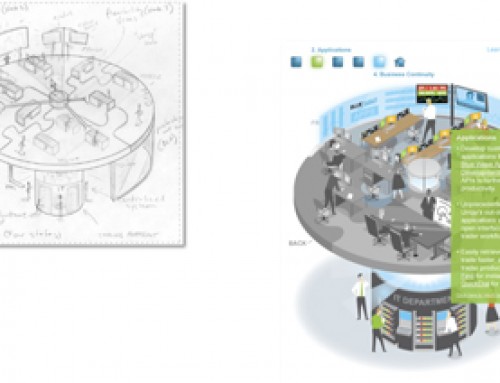
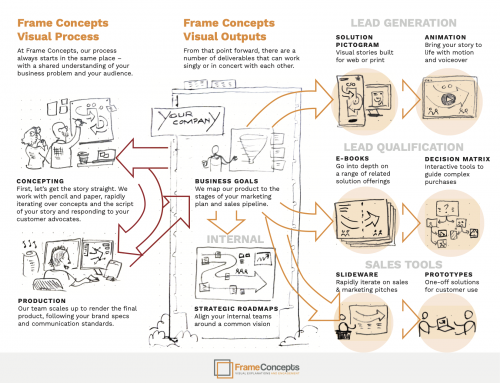
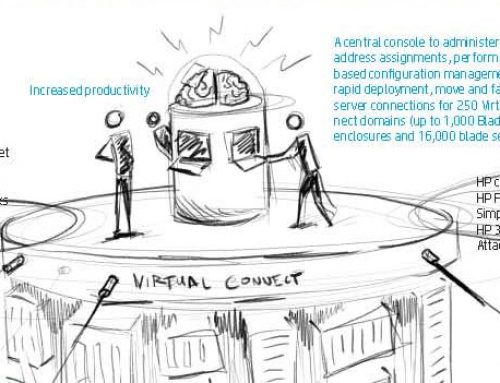
How To:
The most important thing about infographics to remember is that you’re telling a complex story with data. Therefore, you need to strive to keep it as simple as possible. Below are some tips that will help you:
- Simplicity is key
- Data presented should be factual and statistical – no inferences in statistics!
- Reference your facts and statistics
- Inferences made should be clearly indicated as such and logical
- Keep color use to a minimum – decide on a specific color combination
- Make conclusions or predictions
In addition to using social media to promote your infographic, email should be considered, but with caution. Since most infographics are in essence large .jpg or .png files, incorporating the full version into your email campaigns is not recommended. Instead, create either a scaled down version or a sliced part of the original version with a click-though to the graphic itself. Don’t forget to include social media posting capabilities on the page where the graphic resides.
