Infographics for Business
As offerings and subject matter get more complex and audiences attention span shrink, infographics are becoming increasingly a staple to drive content programs.
The Frame Concepts Infographics solution can simply be deployed for a single infographic or can be integrated into complete retained visual content program built around our client’s editorial calendar.
Business Purpose
Increase Viral Shares and Engagement
The business purposes for each of our client’s deployment of the Frame Visual Content Programs are as varied as the infographic styles we create but some of the more typical goals include:
- Outreach Engagement – Increase audience engagement with regular content series including newsletters, marketing automation email-based content series, blogs, social networking and research programs.
- Complex Content Simplification – Enable your audience to both understand and engage with your complex and often research-based subject matter.
- Increase the Viral Factor – Dense written blog and social network content does not promote viral sharing, while a one page engaging infographic encourages viewers to share and increase the awareness of your content programs.
- Enjoyment and Entertainment Factor – While our clients research and content can be important, they are competing with other information sources for their audience’s reading attention and an engaging visual can be the difference that causes the audience to actually look forward to the next infographic series topic.
- Underscores the Importance of Your Topic – The very fact that you have taken the time to develop a visual story to drive that ah-hah moment in a very sophisticated visual presentation suggests the importance of the topic and your attention-challenged audience appreciates that you value their time.
Showcase
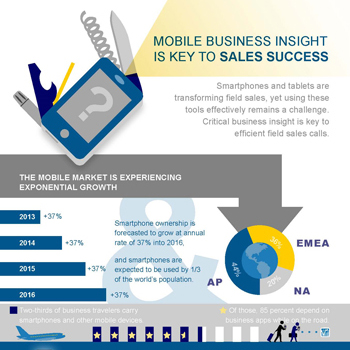
The Dun and Bradstreet Innovation Lab based in New York wanted to showcase how their comprehensive databases of financial information focused in the SMB space could integrate with innovative technology startups to produce impactful marketplace-specific solutions. One of the first innovative integrated solutions spun out of the lab was mProspector – a mobile solution that enabled field sales representatives to walk into any building or any city street and tell them what businesses existed in that building and neighborhood, key pertinent financial data and staff at that office and capture any additional information from that visit and load it into their company’s CRM tool all while traveling and using only their smartphone. To tease out the innovation and value inherent in the solution, Dun and Bradstreet turned to Frame Concepts to visually package it into the form of a one page infographic.
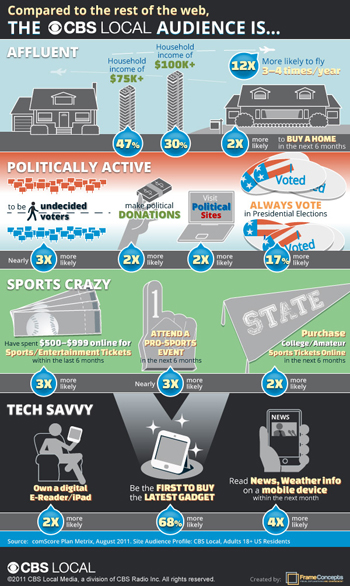
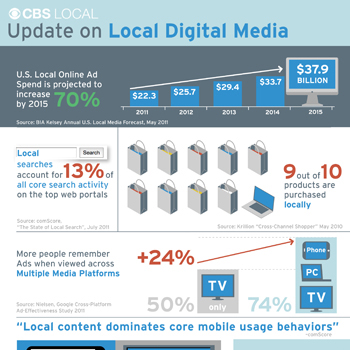
The newly developed digital properties within a relatively new Digital Division needed to communicate their impressive demographic and ecommerce metrics in a visual way that would attract the big brand ad spend during a major industry Ad Week in New York. Frame Concepts took the spreadsheets loaded with impressive data and built a visual narrative and engaging analogies that drove home the value CBS Digital offering to prospective brands. The visuals were quite the star of the event as the buyers were use to boring spreadsheets and charts thus increasing the engagement factor with CBS Trade Show presenters. 


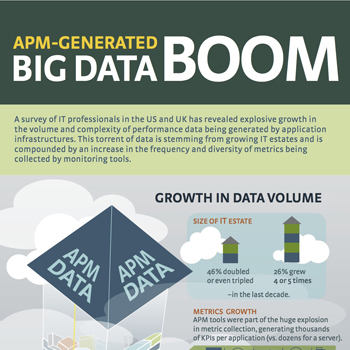
Netuitive, a predictive analytics firm, wanted to underscore how big data was having a impact on enterprise’s ability to sort through the data deluge. To show case to need to come up with a analytics solution to effectively perform APM (application performance management) and proactively resolve issues that get buried in the mountains of increasing data, they leverage Frame Concepts to visualize the number problem. The unusual application for this piece was not the fact they included it in their website in their news section but they effectively used it to debrief research analysts on their problem and their point of view on it.


