Introduction
Research is Doomed without Audience Understanding and Engagement
 While research might be contrasted with sales, make no mistake about it, with research there is a sell going on. The months of data gathering, survey development, audience selection, synthesis and analysis of the data, copywriting and publication layout are all driving to a point – a point where recommendations are made and your audience reacts. And what if your audience does not understand your research and is confused on how to action with your recommendations or cannot be bothered to pour through your data-based argumentation. In short – what if they don’t care. Unless you live in a research vacuum the whole point of your practice becomes redundant unless your audience understand and is engaged. This is where the Frame Concepts Visual Solutions can help with Research Industry Data Visualizations.
Business Purpose
Complex Process Improvement Needs Intuitive Visual Communication
The range of business goals related to your research suggest ample benefits from visualization:
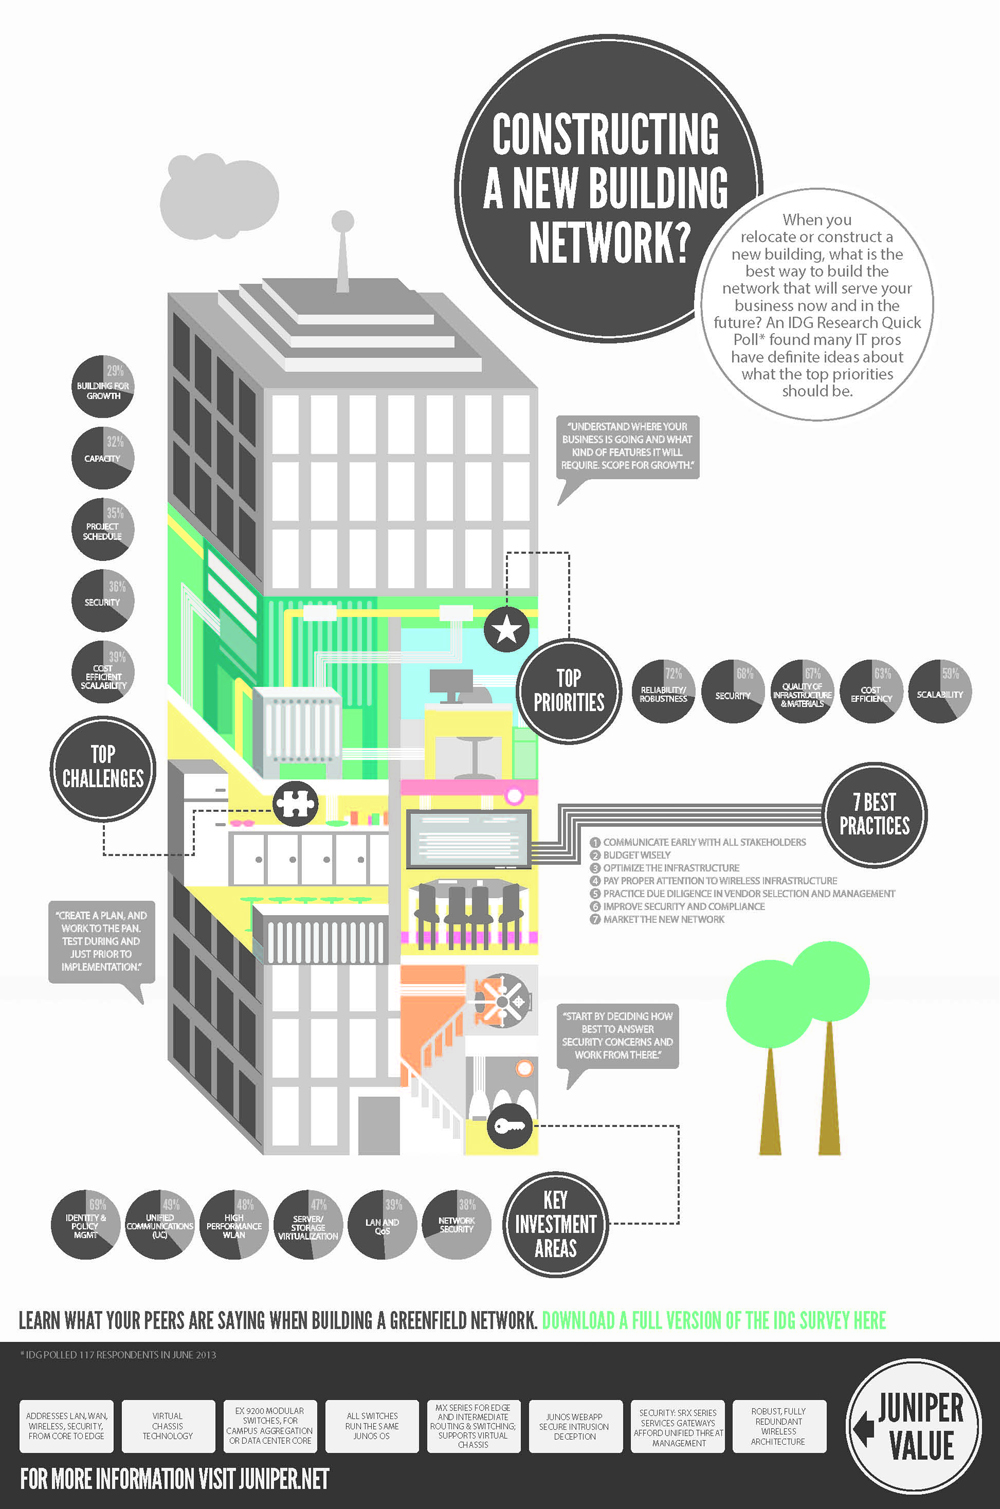
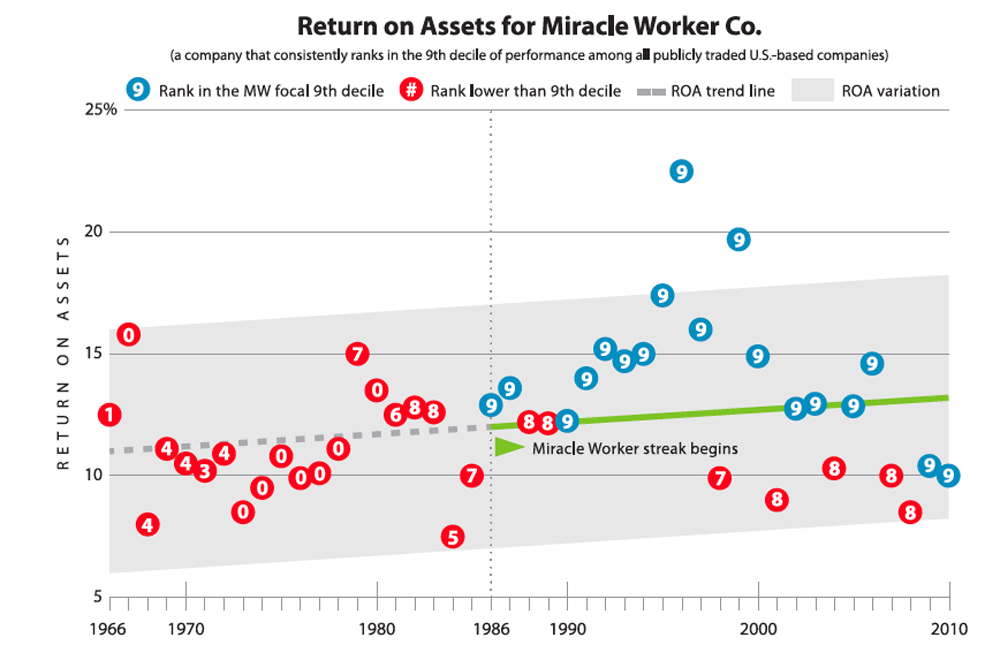
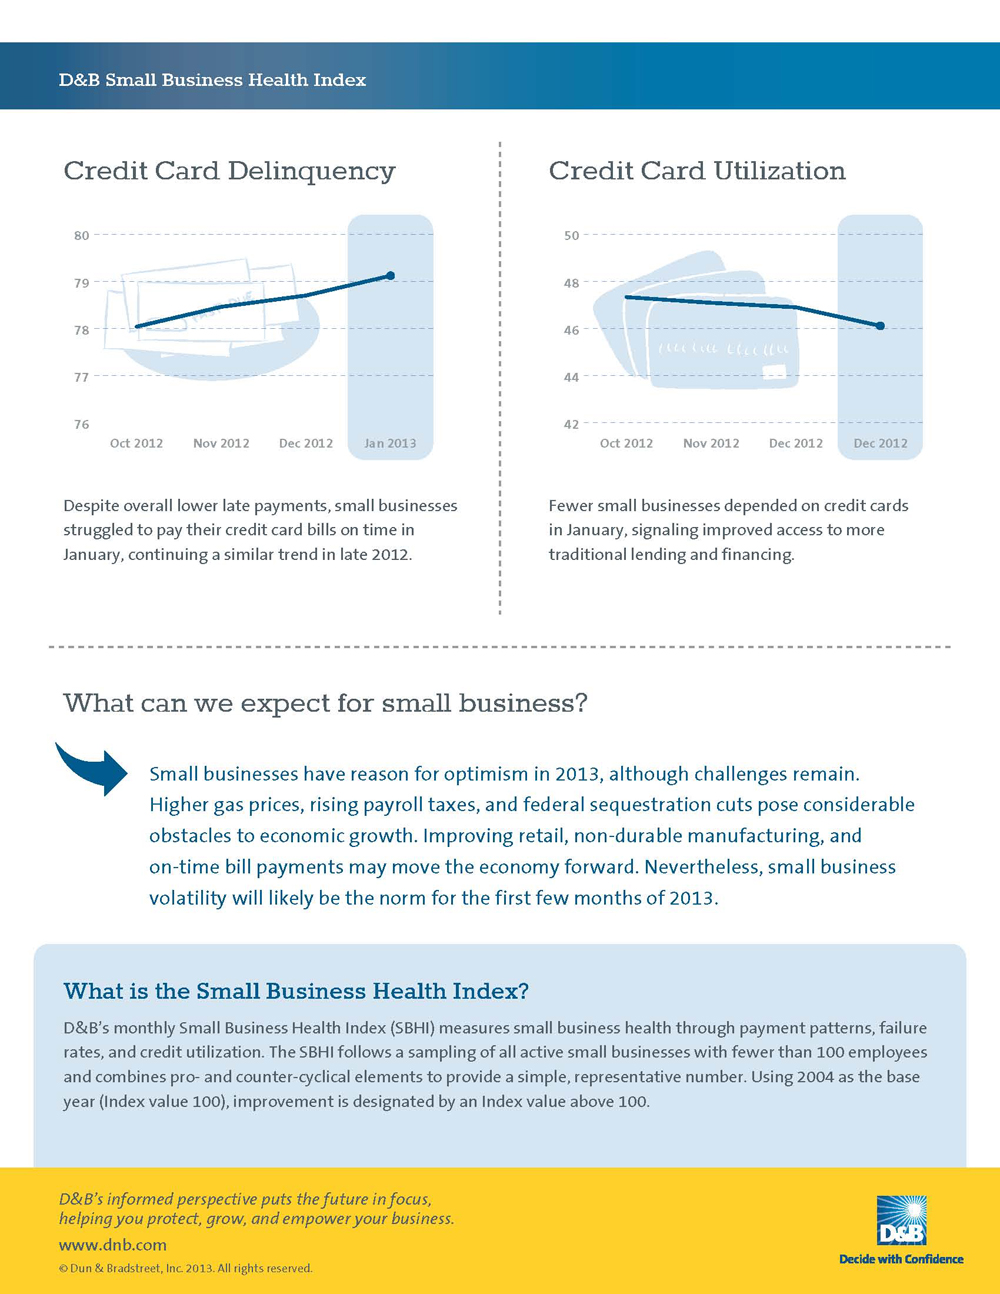
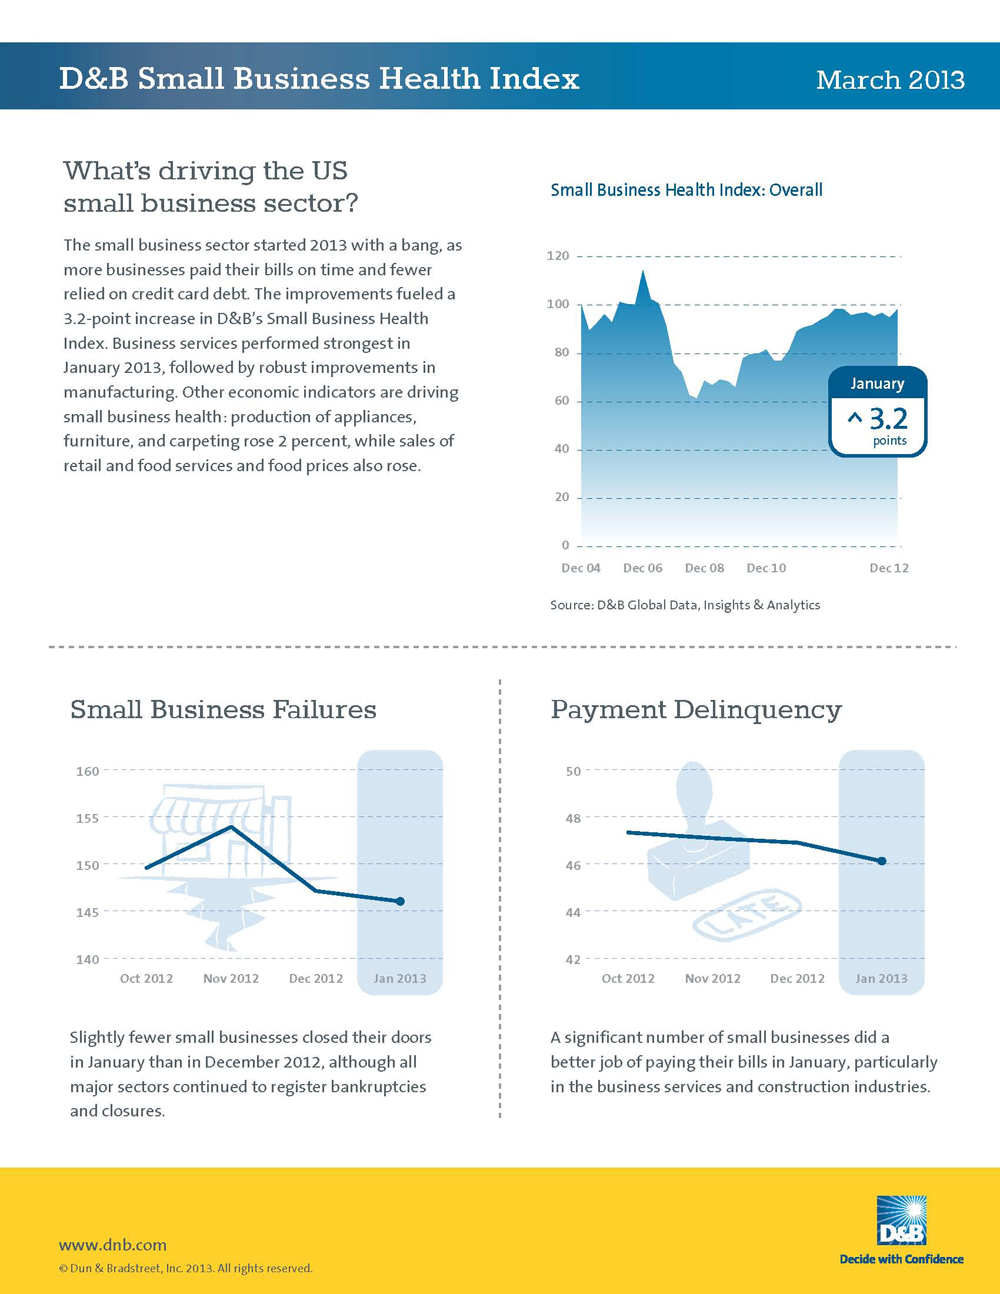
- Dense Data Needs to be Visually Unpacked – The surprising results need to quickly visually shown through effective data visualization.
- Bring Them Conceptually Onboard – Pushing for a new framework or business model or technical approach – visual analogies in the form of pictograms can get them over the conceptual hump.
- Research Reports are Boring – or so the stigma goes – you put so much effort, time, resources and budget against the research – why would you drop the ball when you are trying to communicate to your audience?
- Are your “Ah-hah” Conclusions Lost on Your Audience? – Do they seem less excited, perhaps confused after they read the last page? You need them to visualize the end-results.
- Research Abandonment – loads and loads of text and spreadsheets hamper learning and retention and cause your viewer to drop off. Intuitive visuals bring them in and get them into your point of view.
- You’re a Professional Research Firm Right? – You have stellar specialization in your client’s industries and professional practices and you dress nicely when you present – why do your research presentations look like 1980’s powerpoint clip art with excel charts and cheesy stock photo’s? Your client thinks you don’t care about them getting it. Do you care?
Showcase
More Examples
To see more samples of the Frame Concepts Social Media and Visual Solutions as well as other visual solutions, click here to view a sortable portfolio.