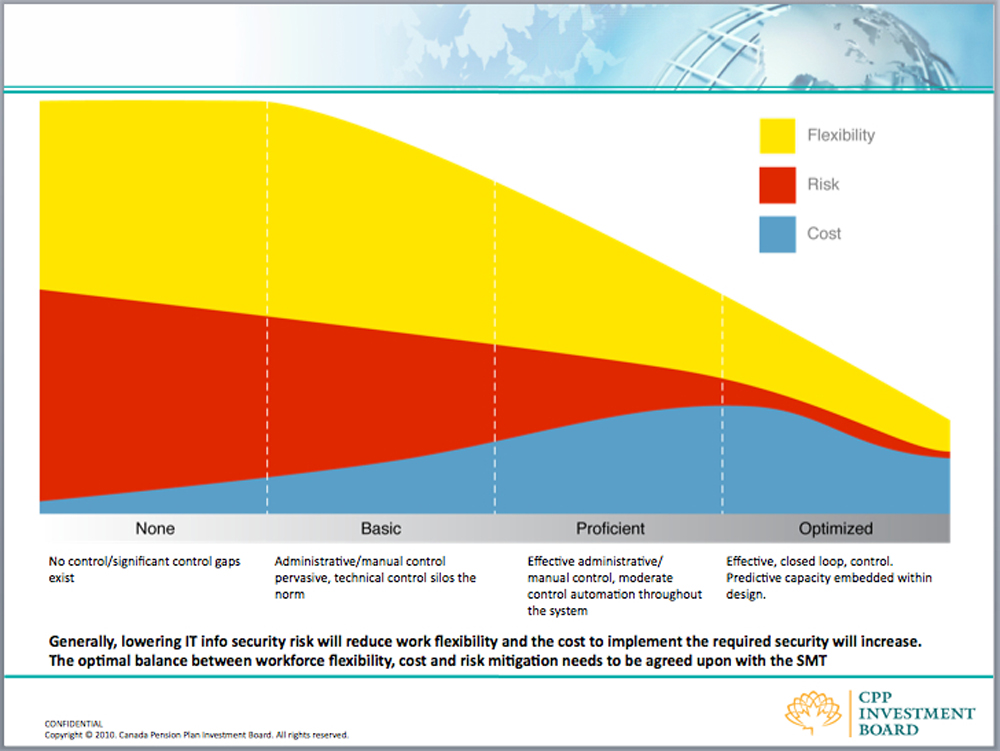
Introduction
Whats Your Vision for Innovation? Is it clear?
 Long before the big client wins and marketplace domination and innovation awards, your new offering exists only as an idea. The core idea needs to be crystallized and visualized to get internal buy-in and the solution needs to be packaged so that clients can adopt it quickly. And sometimes the solution itself has a data component to it that needs data visualization lift. That’s where the Frame Concepts Product Development and Programmer Visual Solutions come in. Through our rigorous pencil sketch ideation phase and then our audience value mapping pictograms and our interface data visualization development, we ensure all audiences including your own management visualize the concept and get onboard.
Business Purpose
Even at the Ideation Phase there is a Big Sell Going On.
Product Development and Programmers tend to go to whiteboard in the ideation phase but when they go package the ideas to management approval or beta client testing the communications can be less that desirable. Sometimes very good ideas are not executed because the product teams cannot clearly articulate the vision. The Frame Concepts Product Development and Programmer Visual Solutions deliver a lot of benefits:
- Make Your Product Intuitive to Use – You don’t want all the innovative features you have loaded into the product to be missed with a clunky interface.
- Making the Data Actionable – By connecting your live database to compelling dynamic data visualization, your users will know how to drive results.
- Package the Concept to Get Buy-In – Smartphone photos of your whiteboard session wont cut it – you need them to see the vision.
- Increase Client Satisfaction – by mapping the information design so the user follows logical workflows and can easily digest the information, user delight increases.
- Increase the Wow Factor – Of course your user interface is not a consumer package product but there are a lot applications out there and you need them to adopt your offering before they will appreciate its finer points.
Showcase


More Examples
To see more samples of the Frame Concepts Social Media and Visual Solutions as well as other visual solutions, click here to view a sortable portfolio.