Introduction
Showing Value Through the Technical Jargon
 The IT Networking Industry has several challenges when trying to gets its audience to appreciate the value of different approaches and innovative technology. On one side, the network for the business user is “assumed” to be there and conceptually amounts to just plumbing to connect data and on the other side its hard to visualize value by making what seems modest improvements in performance with technical measurements and hardware that seems to borrow terminology better suited in a Star Trek episode. The irony is that the IT network is the poster child for content for an effective IT process pictogram. The process steps and technical features of each node and more importantly the value to each respective stakeholder can easily be brought out in a print or interactive pictogram.
Business Purpose
Subtle Technical Advances Translate to Huge Business Advantages
Given the classic dichotomy of translating technical features of an IT Network to a business audience, showcasing business value with visual solutions is ripe for opportunities:
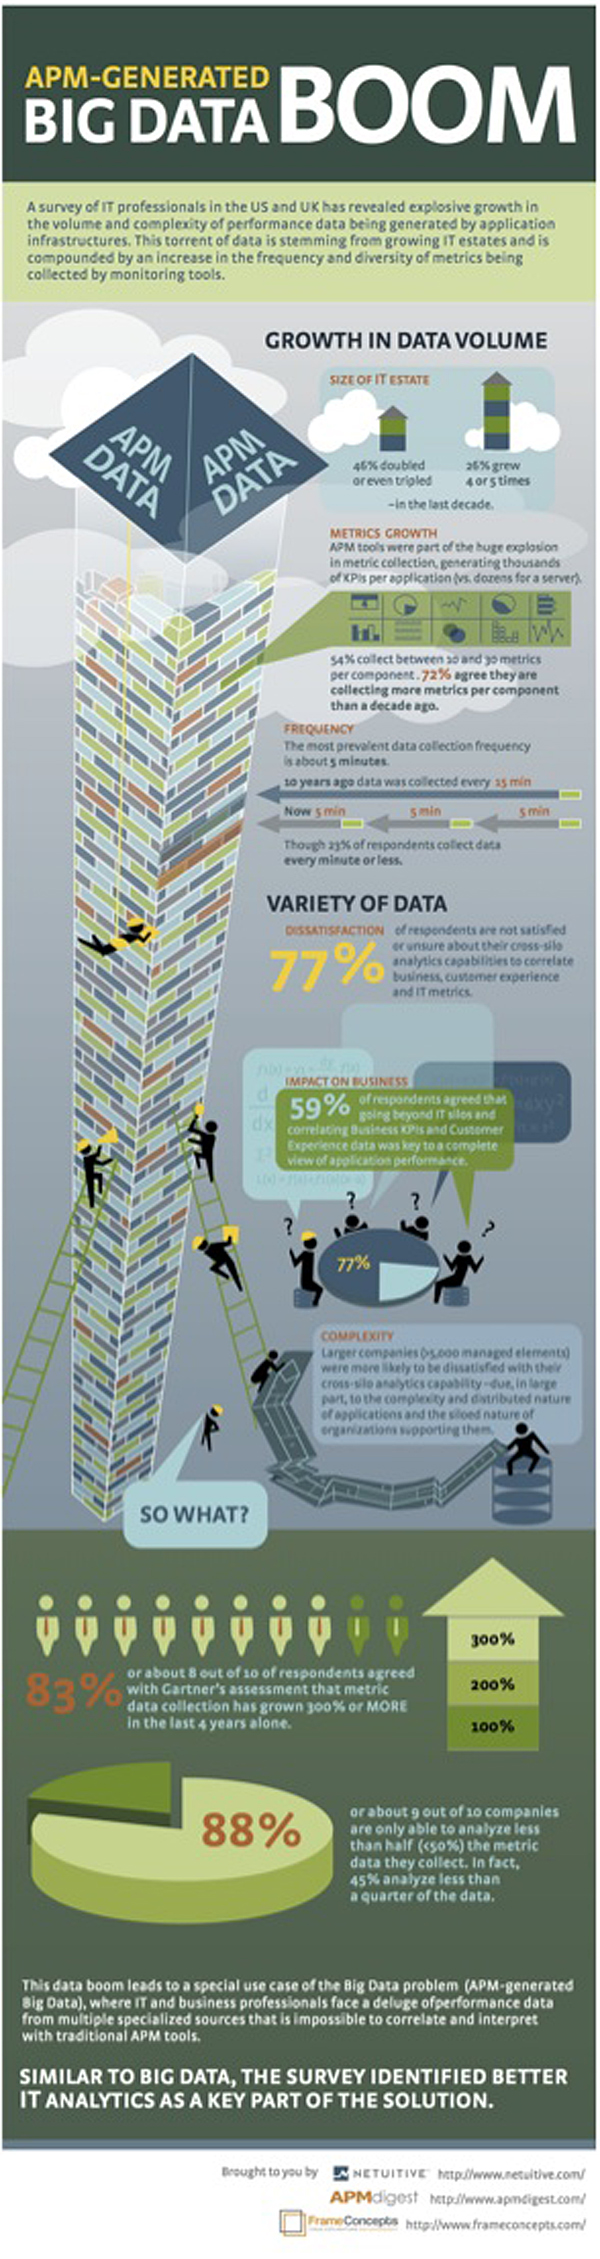
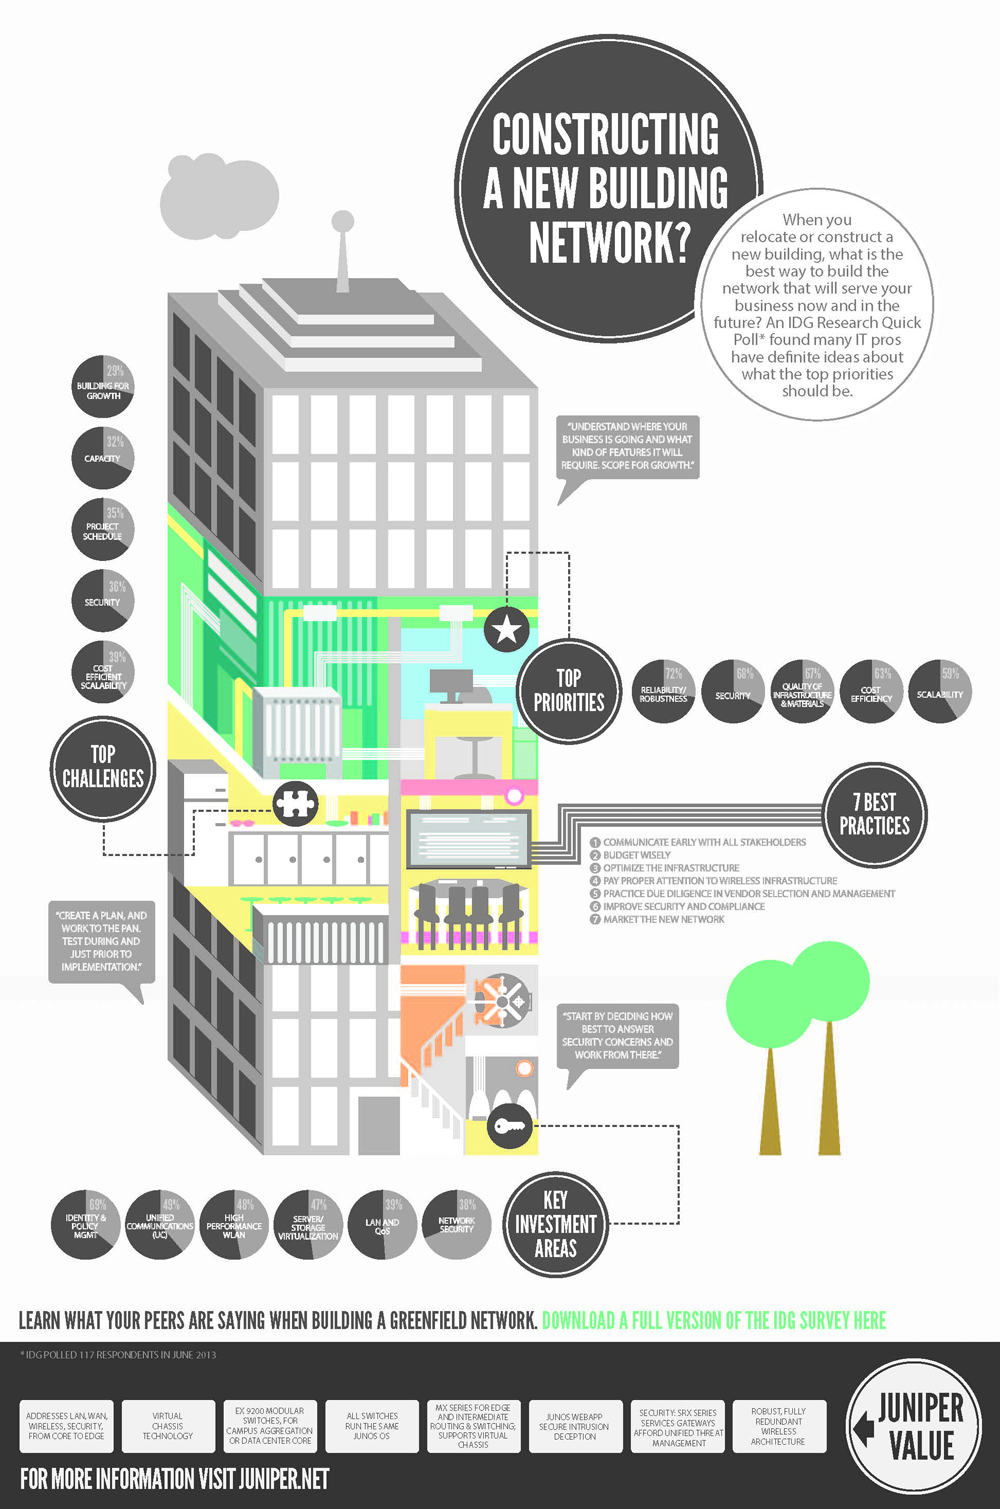
- Visualizing the Point of the Network – while you may have a global network, the point and value can be driven home in one infographic.
- Security and Privacy – While you are keeping the cyber terrorists out you have to make sure the users understands best practices to make your network secure.
- Multiple Concepts – Your IT Network lives in a ecosystem of hardware, cable, clients servers, databases and software – you need your audience to understand your approach on their non-technical terms.
- Measured in Fractions of Percentages – you need to visually show how your hard won incremental performance improves translates to real business value.
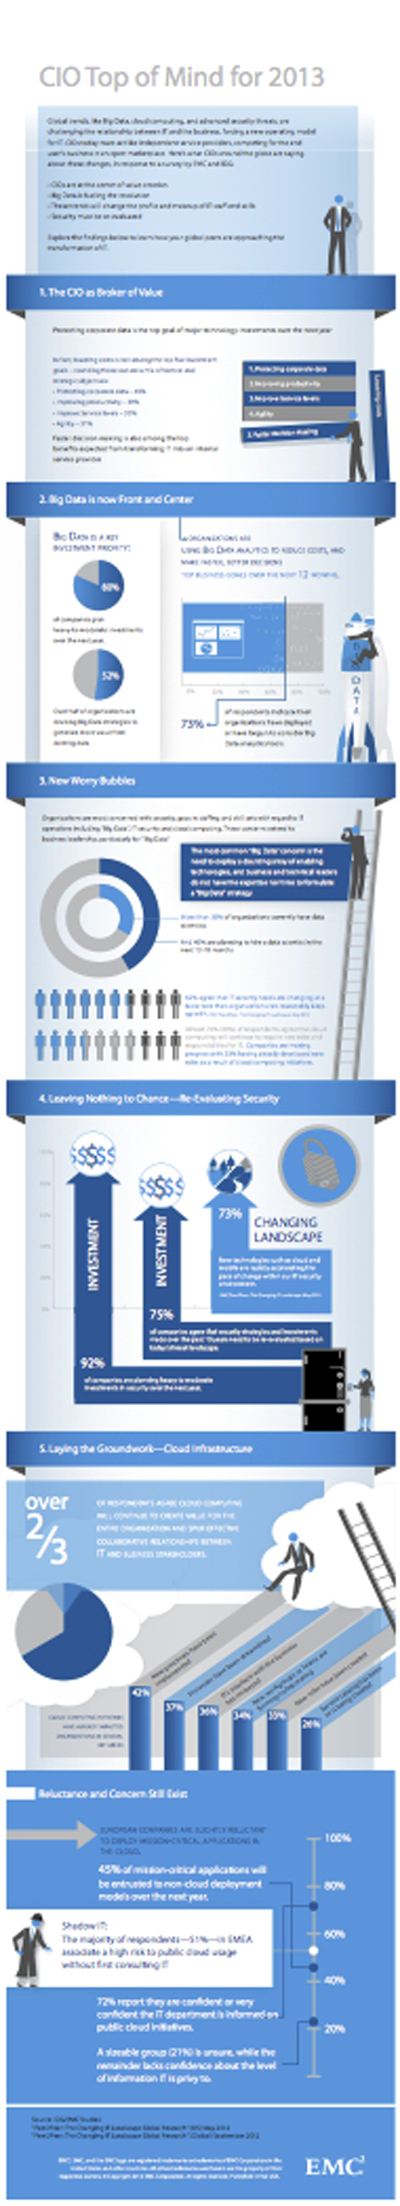
- Up the Engagement Factor – Lets face it – most of your business audience finds discussion points on IT Networking boring. Visual Solutions can showcase the business challenge and the innovation you are applying to deliver real business value and bring them to your point of view.
Showcase
More Examples
To see more samples of the Frame Concepts Social Media and Visual Solutions as well as other visual solutions, click here to view a sortable portfolio.