Introduction
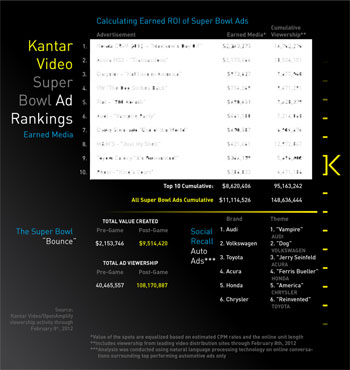
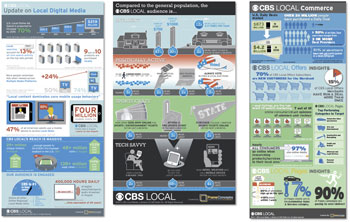
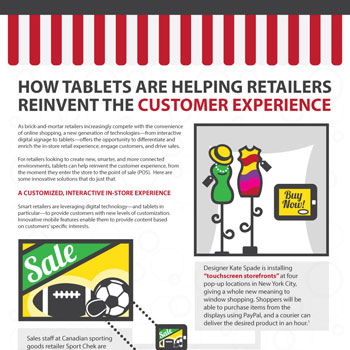
A Poster Child for Data Visualizations
 Retail and Ecommerce solutions live and die by effective analysis of offline and online metrics. Data visualizations can help make more effective business decisions and can impress your clients by showcasing how your solution makes significant impact on the bottomline. When a fraction of percentage in movement on credit card failure can result in millions in losses or gains – its imperative to get a clear picture so the whole organization is onboard. This is where Frame can help.
Business Purpose
Shake Up Stodgy Energy “Commodity” with Dynamic Visualizations
While data visualizations are key, there a host of innovative ways Retail and Ecommerce players are leveraging the Frame Concepts Visual Solutions:
- If you Improve Metrics then Show it – Do not burry your business metrics improvements in spreadsheets.
- Subtle Improvements have a Big Impact – Visually tease out the exponential impact on profits with slight metrics adjustments.
- Manual Spreadsheet Presentations are Clunky – Its more efficient and effective to impress your clients with a dynamic data-visualization.
- Retail and Ecommerce is Not Seen as Innovative – The high stakes and highly competitive retail and ecommerce marketplace is rife with bottom-line driven innovation that needs visual explanation.
- Logistical Efficiencies need to be Showcased – process pictograms will highlight the point and value of your innovation.
Showcase

More Examples
To see more samples of the Frame Concepts Social Media and Visual Solutions as well as other visual solutions, click here to view a sortable portfolio.


