Introduction
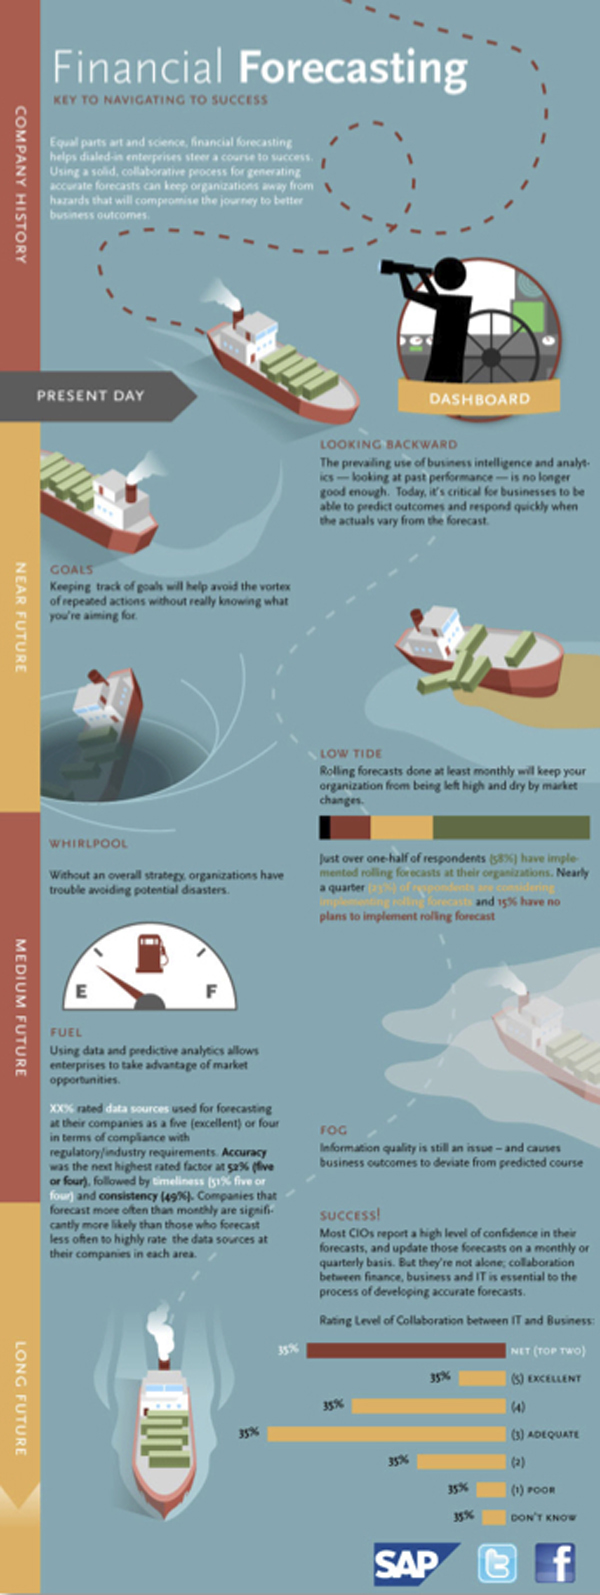
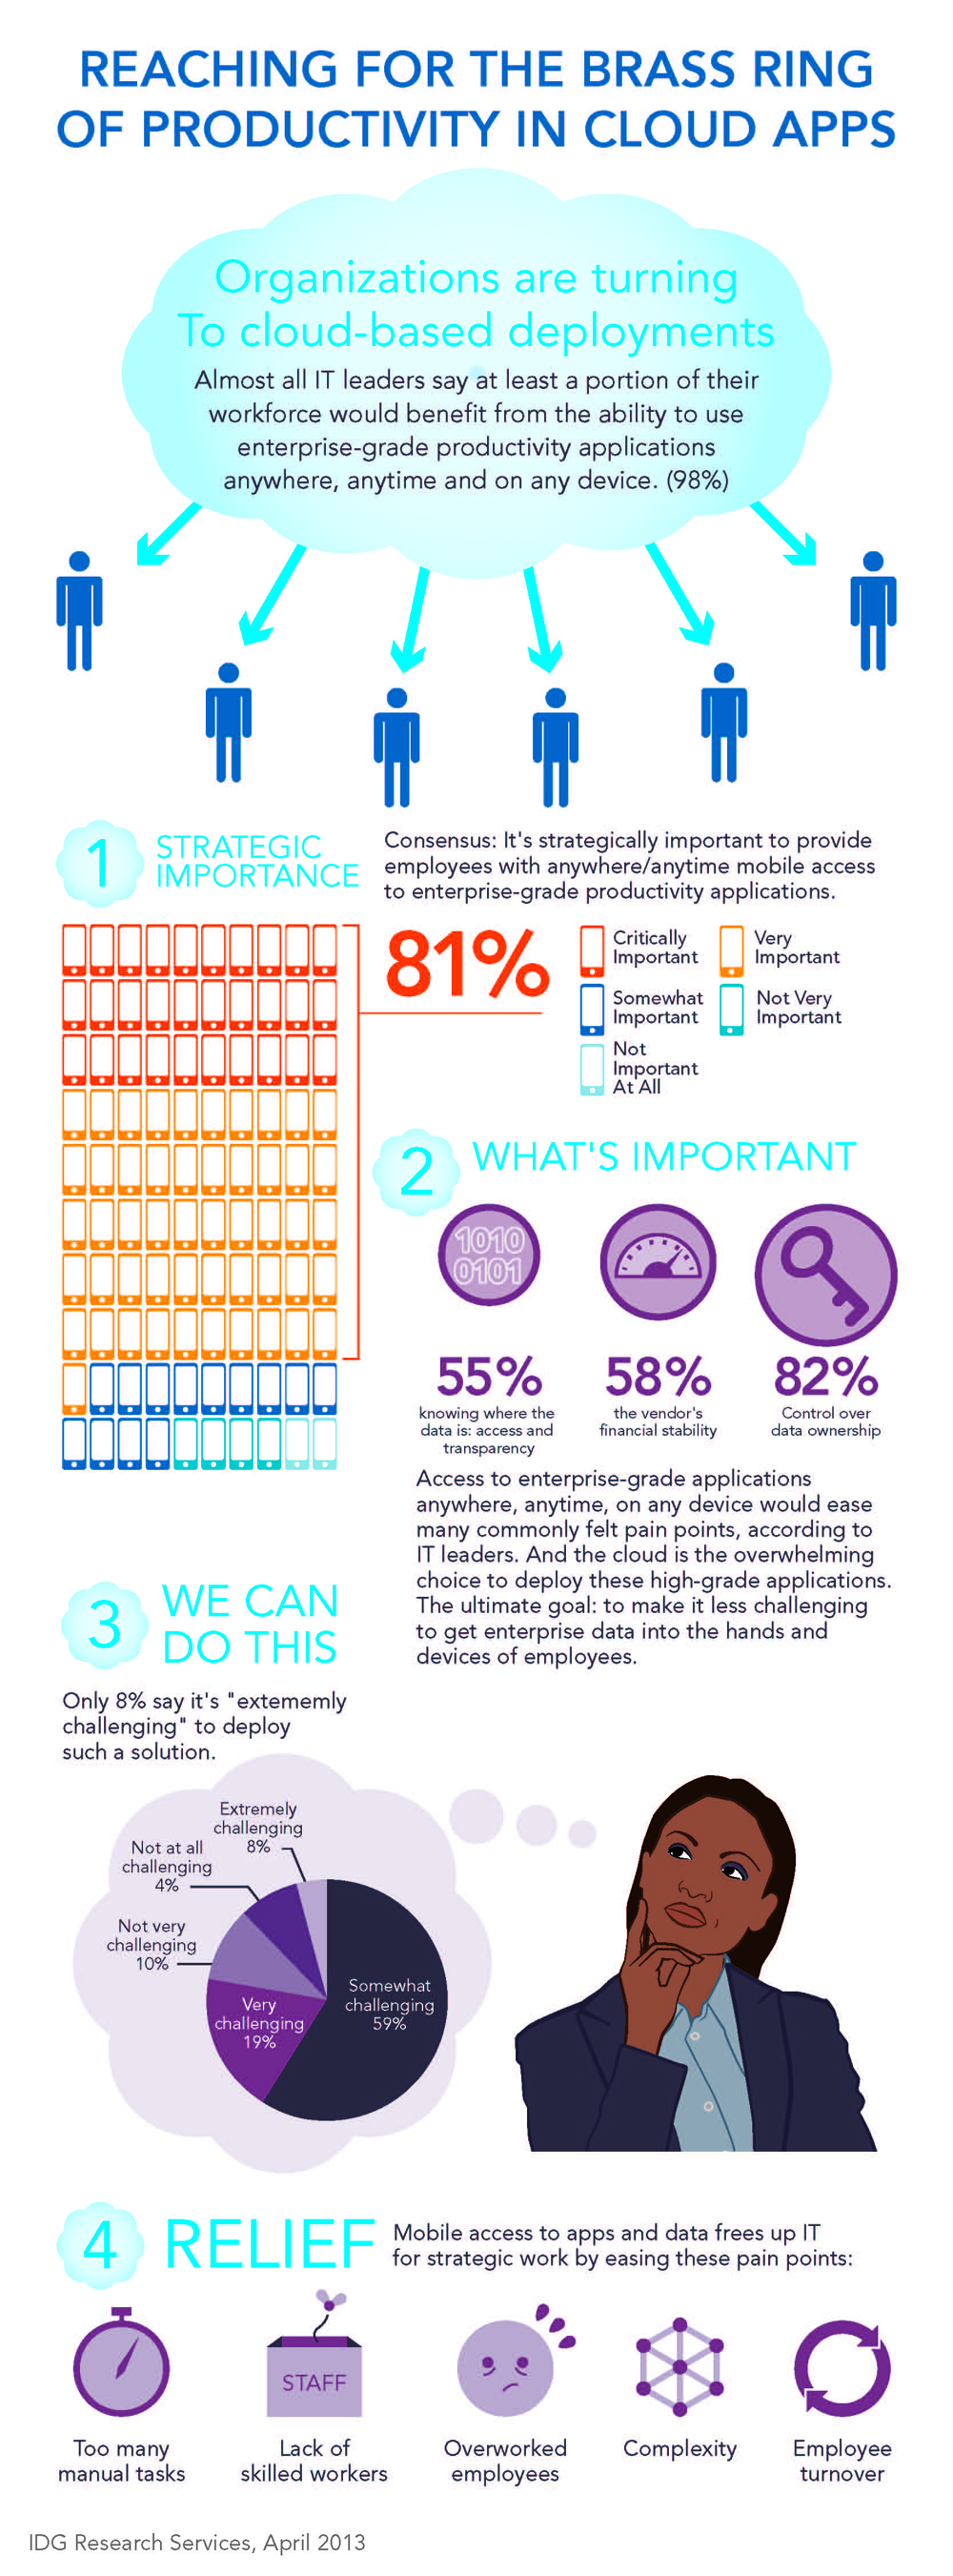
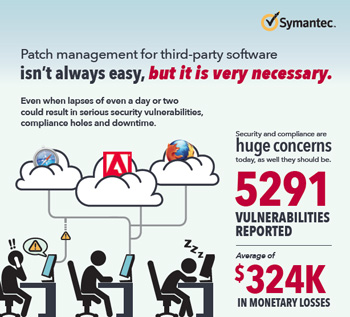
Visualizing the Value Behind the Code
 There is a lot of value lurking behind that impressive interface, the challenge is how do you get the potential business user to appreciate that fact without using it? Screenshots and lists of technical features and even a recorded screenshot demonstration can often miss the differentiated value points. And of course you need to engage your visitor. You need to bring your software solution into the context of your audiences business goals and show the visually how easy it is to set up and operate in conjunction with their preferred business practices and how it will deliver value for each stakeholder. This is where Frame Concepts Software Industry Visual Solutions can help.
Business Purpose
Adoption is Key
Of course the end goal is to increase the adoption of your software platform and the only way that is going to happen is if your marketplace and analysts are as excited about the unique benefits your solution deliver as your team is when you developed it. You need your marketplace (and maybe your staff) onboard with that vision to accomplish your business goals:
- Adopting New Platform – you need your prospects to envision the end state when they adopt your platform
- Business Value – While it’s software code, you need to get out the value of the offering to your audience
- Product Development Ideation – Before you present to your client, you need to get your own team onboard and a clear vision of your product road map.
- Increase Software Renewal Rate – Timely metric-driven visual communication can remind client the value they are currently receiving.
- Software can be Intimidating – Taking on a new platform can be a formidable task, you need to get them visually over that hump.
Showcase
More Examples
To see more samples of the Frame Concepts Social Media and Visual Solutions as well as other visual solutions, click here to view a sortable portfolio.