Introduction
Media Metrics and Platform Delivery Technical Features are Complex
 The Media Industry has it own unique set of communications when trying to present its own set of unique offerings. There is a bit of irony here. The media industry of course by definition provides the most compelling content typically in the form of narratives or news across television, newspapers and magazines, internet, movies and gaming channels. And then to add to the irony, media infographics themselves arrived on the scene largely through the newspaper channel where data journalist told complex stories in the forms of charts and iconography. But positioning your offering is a different thing and this is where the Frame Visual Solutions can help.
Business Purpose
Your Media Buyer is Visual-Oriented
Data, are rather the abundance of data, lies at the core of problem in bringing its audiences onboard with its offerings. Solution Pictograms and Dynamic Data Visualizations are key to getting enagement:
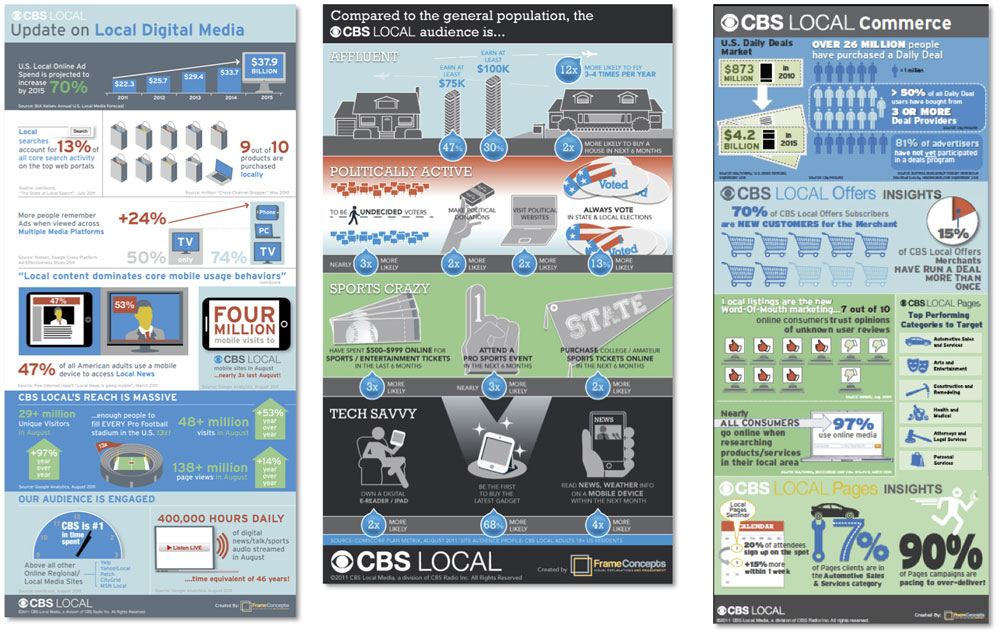
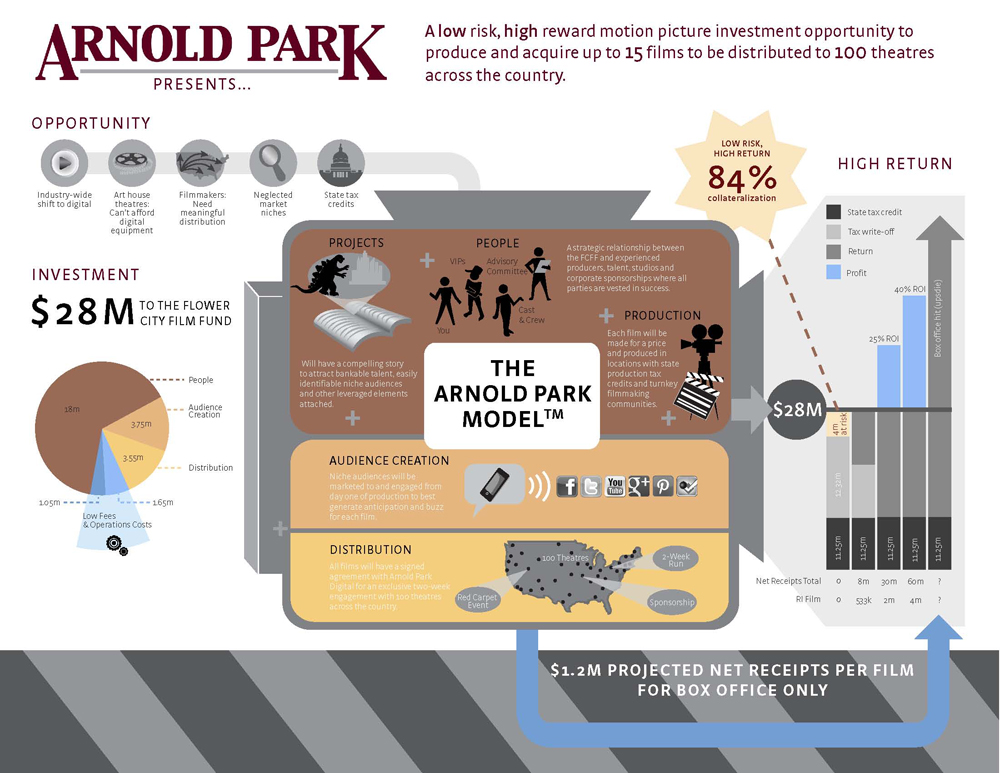
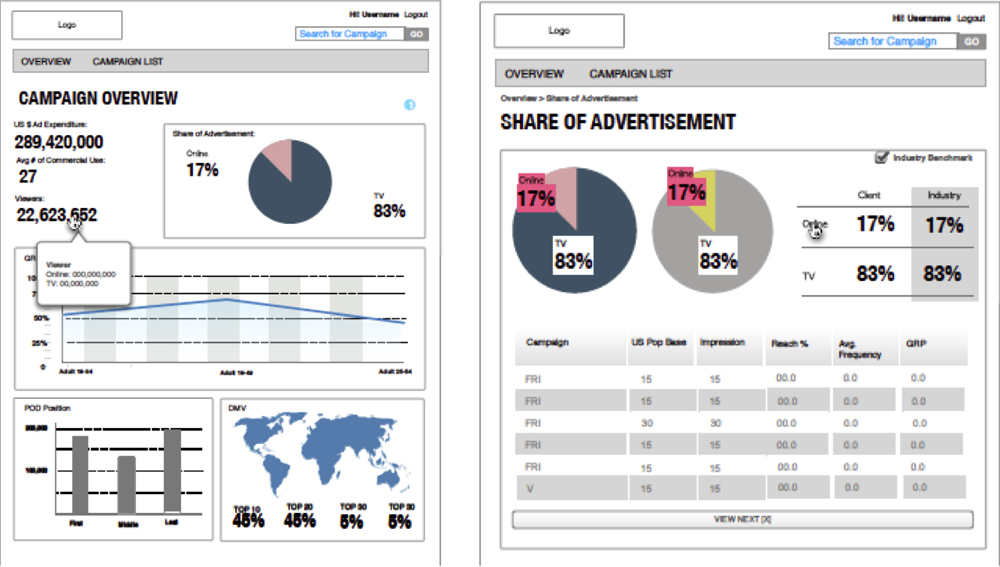
- Showcasing Your Compelling Metrics – if your media channel as attractive demographics and audience numbers then you should make sure your buyer understands this with an intuitive infographic
- Traffic Numbers to Revenue Translation – How your media offering’s compelling traffic numbers translates to revenue needs to be understood.
- The Media Buyer Expects “Sizzle” – Spreadsheet and PowerPoint bullet points with stock photos will underwhelm your media buyer.
- Innovation in Media – Just like your startup colleagues in the Silicon Valley, you need your innovation to be visualized to get buy-in.
- The Complexity of Media Platform Delivery – The media buyer has to come to terms with the technical features of your platform as well as the complex data metrics – why not make it easier on them visually?
Showcase
More Examples
To see more samples of the Frame Concepts Social Media and Visual Solutions as well as other visual solutions, click here to view a sortable portfolio.