Introduction
Finance Presents Layers of Complexity
 Financials Services has it hard in the explanation and engagement game on a number of levels. First the professions themselves – investing, trading, clearing, banking, insurance claim processing – have nuanced goals and processes. And then there are the regulatory bodies and compliance procedures that need to be taken into account as well as profit goals. And then a lot of the processes are running on some of the most complex systems. And the range of solutions to enable these professions can be quite complex – real-time trading, surveillance, ethical hacking, data privacy management…and the list goes on. And finally there are the nuanced relationships between the front, middle and back office that need to integrated into your audience map. Whether you are introducing a new system to the financial services marketplace or you are trying to get your employees on a new initiative, visual solutions can help get your audience onboard.
Business Purpose
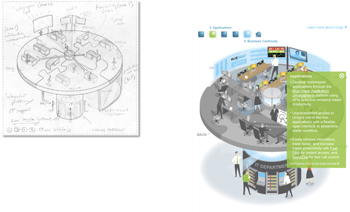
Making the Complex Intuitive
Typically when any innovation in the financial services space is being considered whether on the supplier or client side, there needs to be a level of understanding of how the solution works as well the value that will be delivered to each stakeholder. Frame Concepts Financial Services Visual Solutions can get you there:
- Making Complex Financial Process Intuitive – A pictogram that shows how each stakeholder uses the offering and receives value can quickly get your audience onboard.
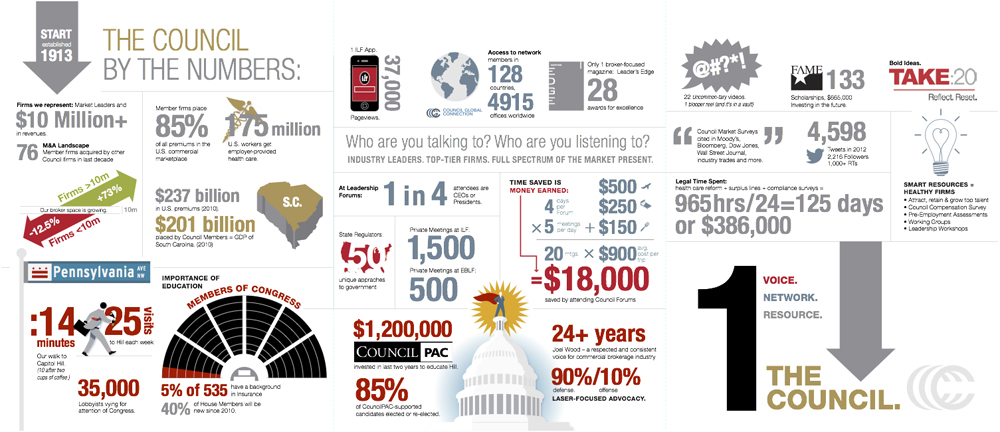
- Making the Financial Data Actionable – By connecting your live database to compelling dynamic data visualization, your users will know how to drive results.
- Package the Concept to Get Buy-In – If you are innovating on a new approach, then our ideation storyboards can get your team and management and beta clients on the same vision.
- Increase Client Satisfaction – You can visually reinforce the financial improvements you are making with data visualization slides or a dynamic data-driven application.
- Increase the Wow Factor – Financial reporting can be dry and your solution steps can appear mundane, but a clever visualization of both of them can make your point.
Showcase

More Examples
To see more samples of the Frame Concepts Social Media and Visual Solutions as well as other visual solutions, click here to view a sortable portfolio.