

Two Recent Projects Got Me Thinking …
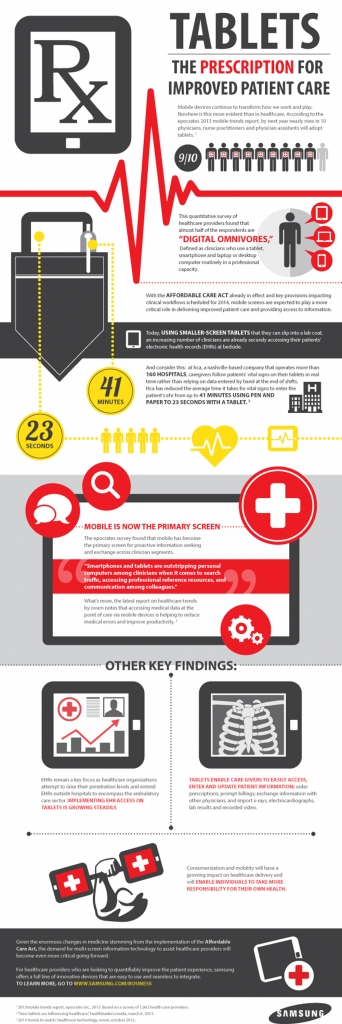
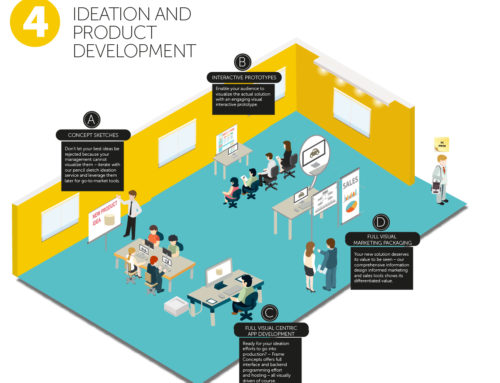
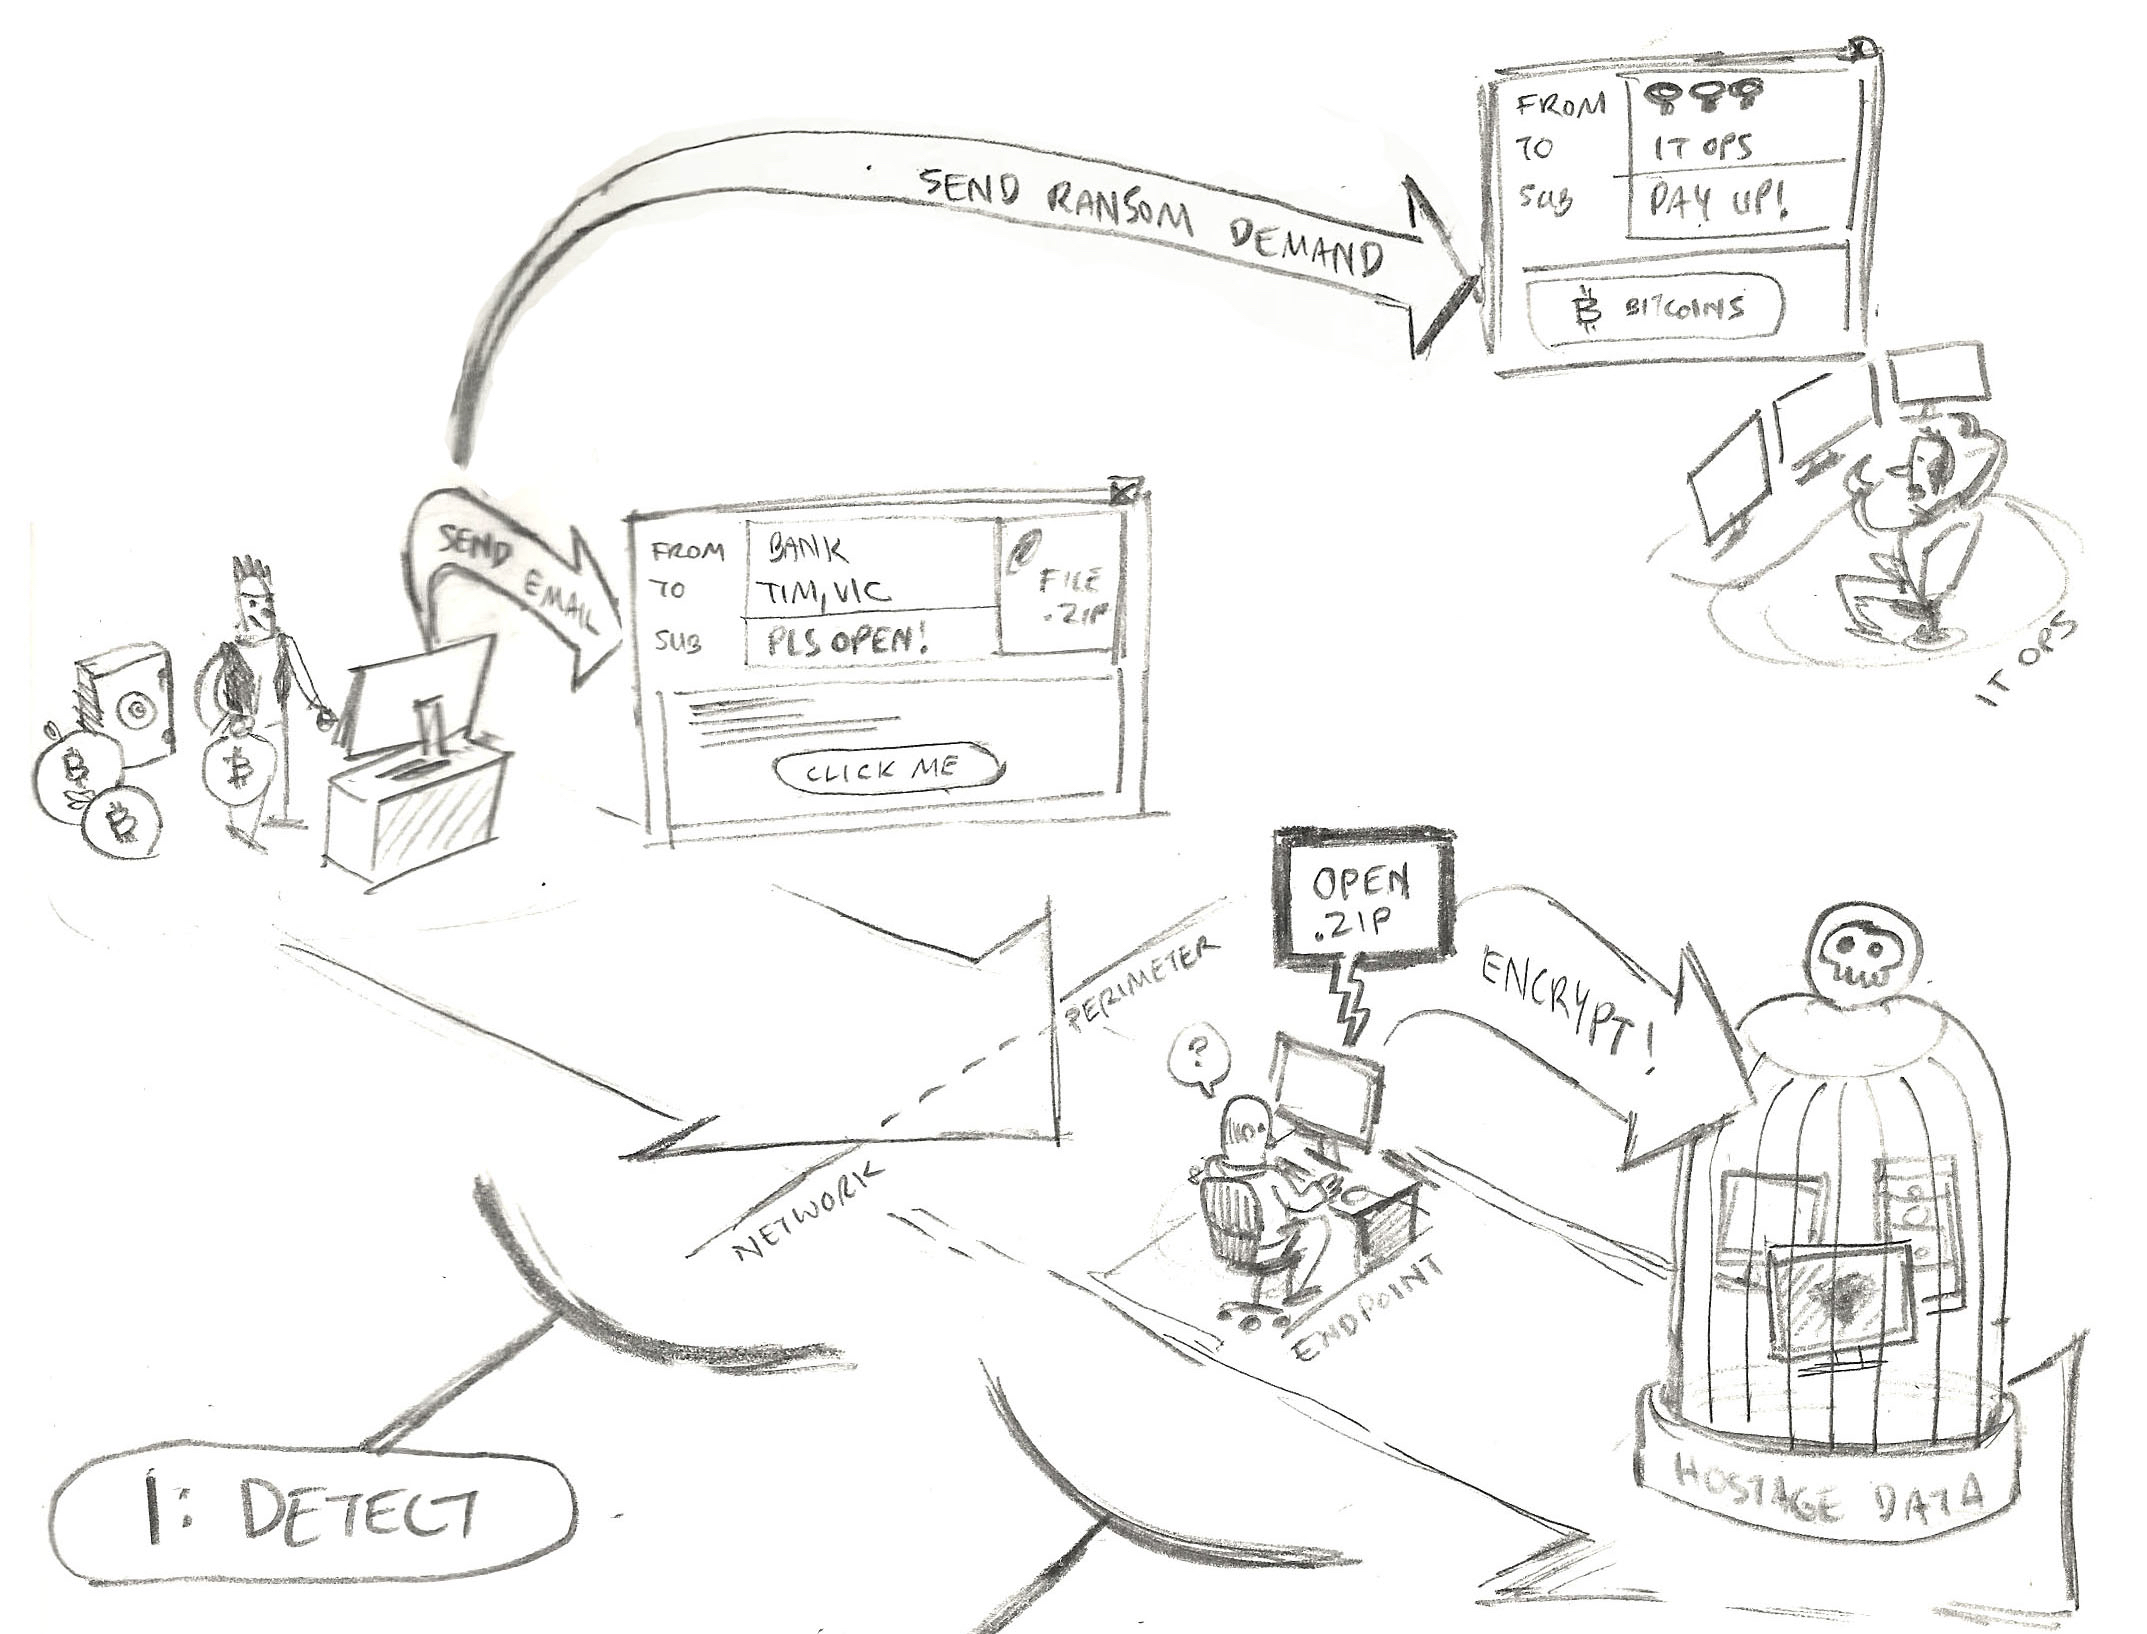
Sample of Standard Infographic Where we First Require a One Page Narrative to Drive Visual Content Ideas
Similar Pattern Between Data-Driven Visualizations and Infographic Startup Concerns
Noticed a pattern in the early stages of both infographic and data visualization projects that are different and the same. One theme (that some of our information designers are quick to point out) is that while the client in their head has a sense of where they want the infographic to go they dont really have it down for an information designer to scope in an actual project. What we really need at the end of the day is a simple one page that lists who the intended audience is and what insight do we want to visually bring them do and what relevant facts and data points do we have to leverage to accomplish that goal.
What we really need at the end of the day is:
- a simple one-pager that lists who the intended audience is and
- what insight do we want to visually bring them do and
- what relevant facts and data points do we have to leverage to accomplish that goal.
But What if the Client Does Not Have the Simple One-Pager
Well there are few ways one can go – if it exists in reference materials or in the client’s head, we can tease it out in the kick-off session before we start brainstorming on pencil sketch concepts. One word of advice for both client and supplier – make sure you write it down and get full approval as this will be the blueprint for the remainder of the project. And of course even if the client comes with the one-pager, there is plenty of room for debate about which points are most important and which ones will be more effectively played out with a certain type of visual approach – icons, illustrations, infographic, pictogram, interactivity or animation. And of course our client can hire us to do some proprietary research if needed (that is not typically as the usual challenge is that the client has TOO much information and we have to operate a heavy editorial hammer to bring into something that is both information and engaging and well… to the point.

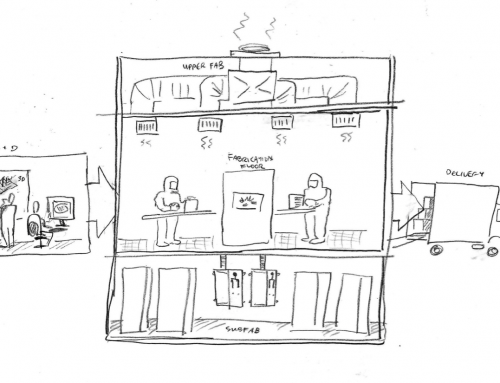
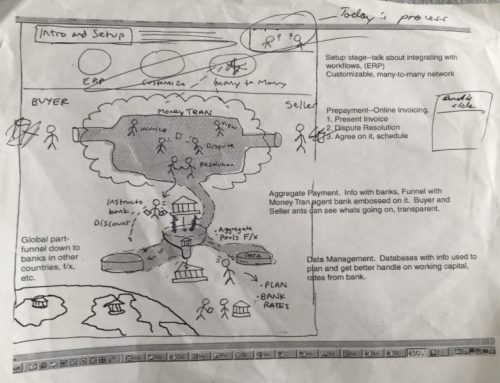
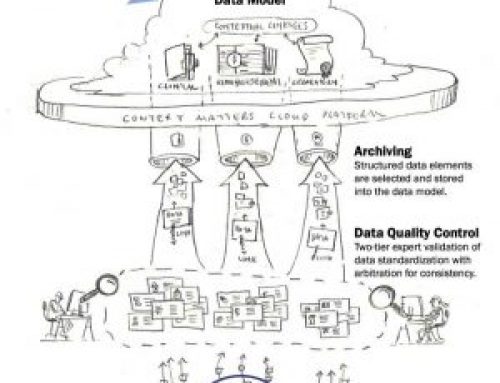
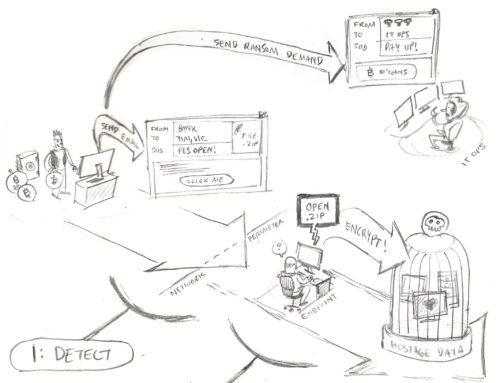
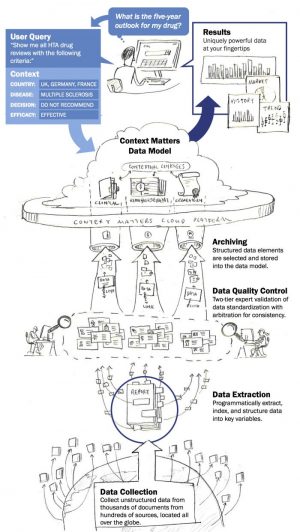
Sample of Dynamic Driven Visualization Which Also Requires Insight Prep Work Upfront
But How Could This Concern be True with Dynamic Data-Driven Visualization – If You Have the Data You are Ready to Go, Right?
Last week we were asked to analyze a vast amount of historical spend data (over ten years worth) to see if we could offer up some meaningful predictive analytics and if so we would build out the predictive model and code it and then build a dynamic data visualization so the user could act on it easily. But not all data sets are created equal as any self-respecting data scientist will tell you. Questions need to be answered – are the parts that being ordered clustered under a certain type? Do we know how many of each part exists in the end unit so we can see percentage of orders against the total part population. Are their external factors like buying cutoff dates, outages, purchasing policies that drive atypical buying patterns and prevent us from correlating this with the actual survival rate of the part in question? So what we have to do is conclude first whether any meaningful insight can gotten from the data BEFORE we actually think about modeling, scripting and designing the data visualization. In a way – its similar to that one-pager we need for the print infographic.

Important in Both Cases to Get Scope Determined Before Development of the Visual Solution
An Insight is an Insight is an Insight
So the concept of an “insight” is a bit of unifying theme here with both print-type infographic visual solution and the dynamic data-driven visualization. And in both cases we are concerned at the start of the project whether scope is ready to go in the visual over are not. For the infographic, we want a one-pager that is baked with the insight against an audience with relevant facts and data. For the data-driven visualization, we wonder if the actual data is sufficient to dynamically drive the relevant insights before we begin to model. If we don’t deliver on either of these at the start of the project – their success is in jeopardy. But with those in play and our craft of information design and technical scripting and programming – we are off to the insight engagement races.
If you would like to talk about leveraging an infographic or a data-driven visualization to engage your audience with your insights, feel free to click here to receive a Free Demo and Consultation.