


Anyone will tell you that planning is essential to leveraging your new visual solutions and this includes infographics. I recently came across a useful guide on deploying infographics in B2B marketing.
I like Mr. Shor’s point when he states:
Don’t Dabble — Have a Plan!
Producing a single infographic usually isn’t worth the effort, plus, it takes more than one attempt to evaluate how well infographics work for your business. Instead of dabbling, commit to one infographic per month or quarter; whatever your team can comfortably support.
You’re likely to experience a rapid learning curve on infographic development. Your fifth or sixth effort will be smoother than the first few — and probably achieve much better results.
As we here at Frame Concepts have been deploying infographics in B2B for the Fortune 500 and some of the most innovative startups for the past four years (and I have been in B2B for the last few decades) we know from experience that the effective learning curve goes rapidly up and so does the engagement when using our rigorous ideation process.
If you would like to a live demonstration of our process in the B2B context, feel free to contact me for a Free Demo and Consultation.
And here is the article from Mr. Shor …
What Is an Infographic?
Infographics are one of the hottest online content forms going. What is an infographic? According to Techopedia:
An information graphic (infographic) is a visual representation of a data set or instructive material. An infographic takes a large amount of information in text or numerical form and then condenses it into a combination of images and text, allowing viewers to quickly grasp the essential insights the data contains. Infographics are not a product of the Web, but the Internet has helped popularize their use as a content medium. (Techopedia)
Why Infographics in B2B Marketing Work

The idea of using visual content in B2B marketing is nothing new. Pie charts, graphs, flow charts and the like have been around since the invention of the pencil, and B2B firms routinely use sites like YouTube and SlideShare to distribute video and slide presentations. Infographics, however, are handy for several reasons:
- First, infographics are hot, so they tend to draw a lot of views when they are shared on Pinterest and other social media sites.
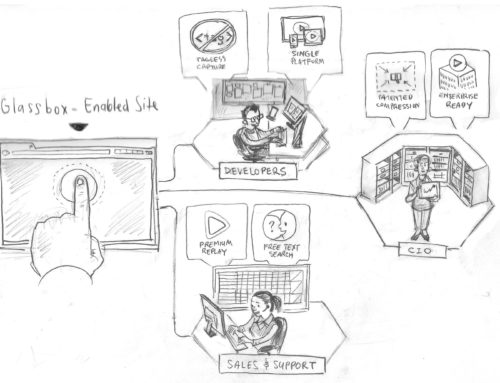
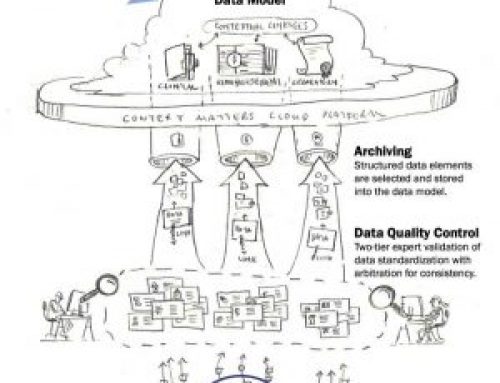
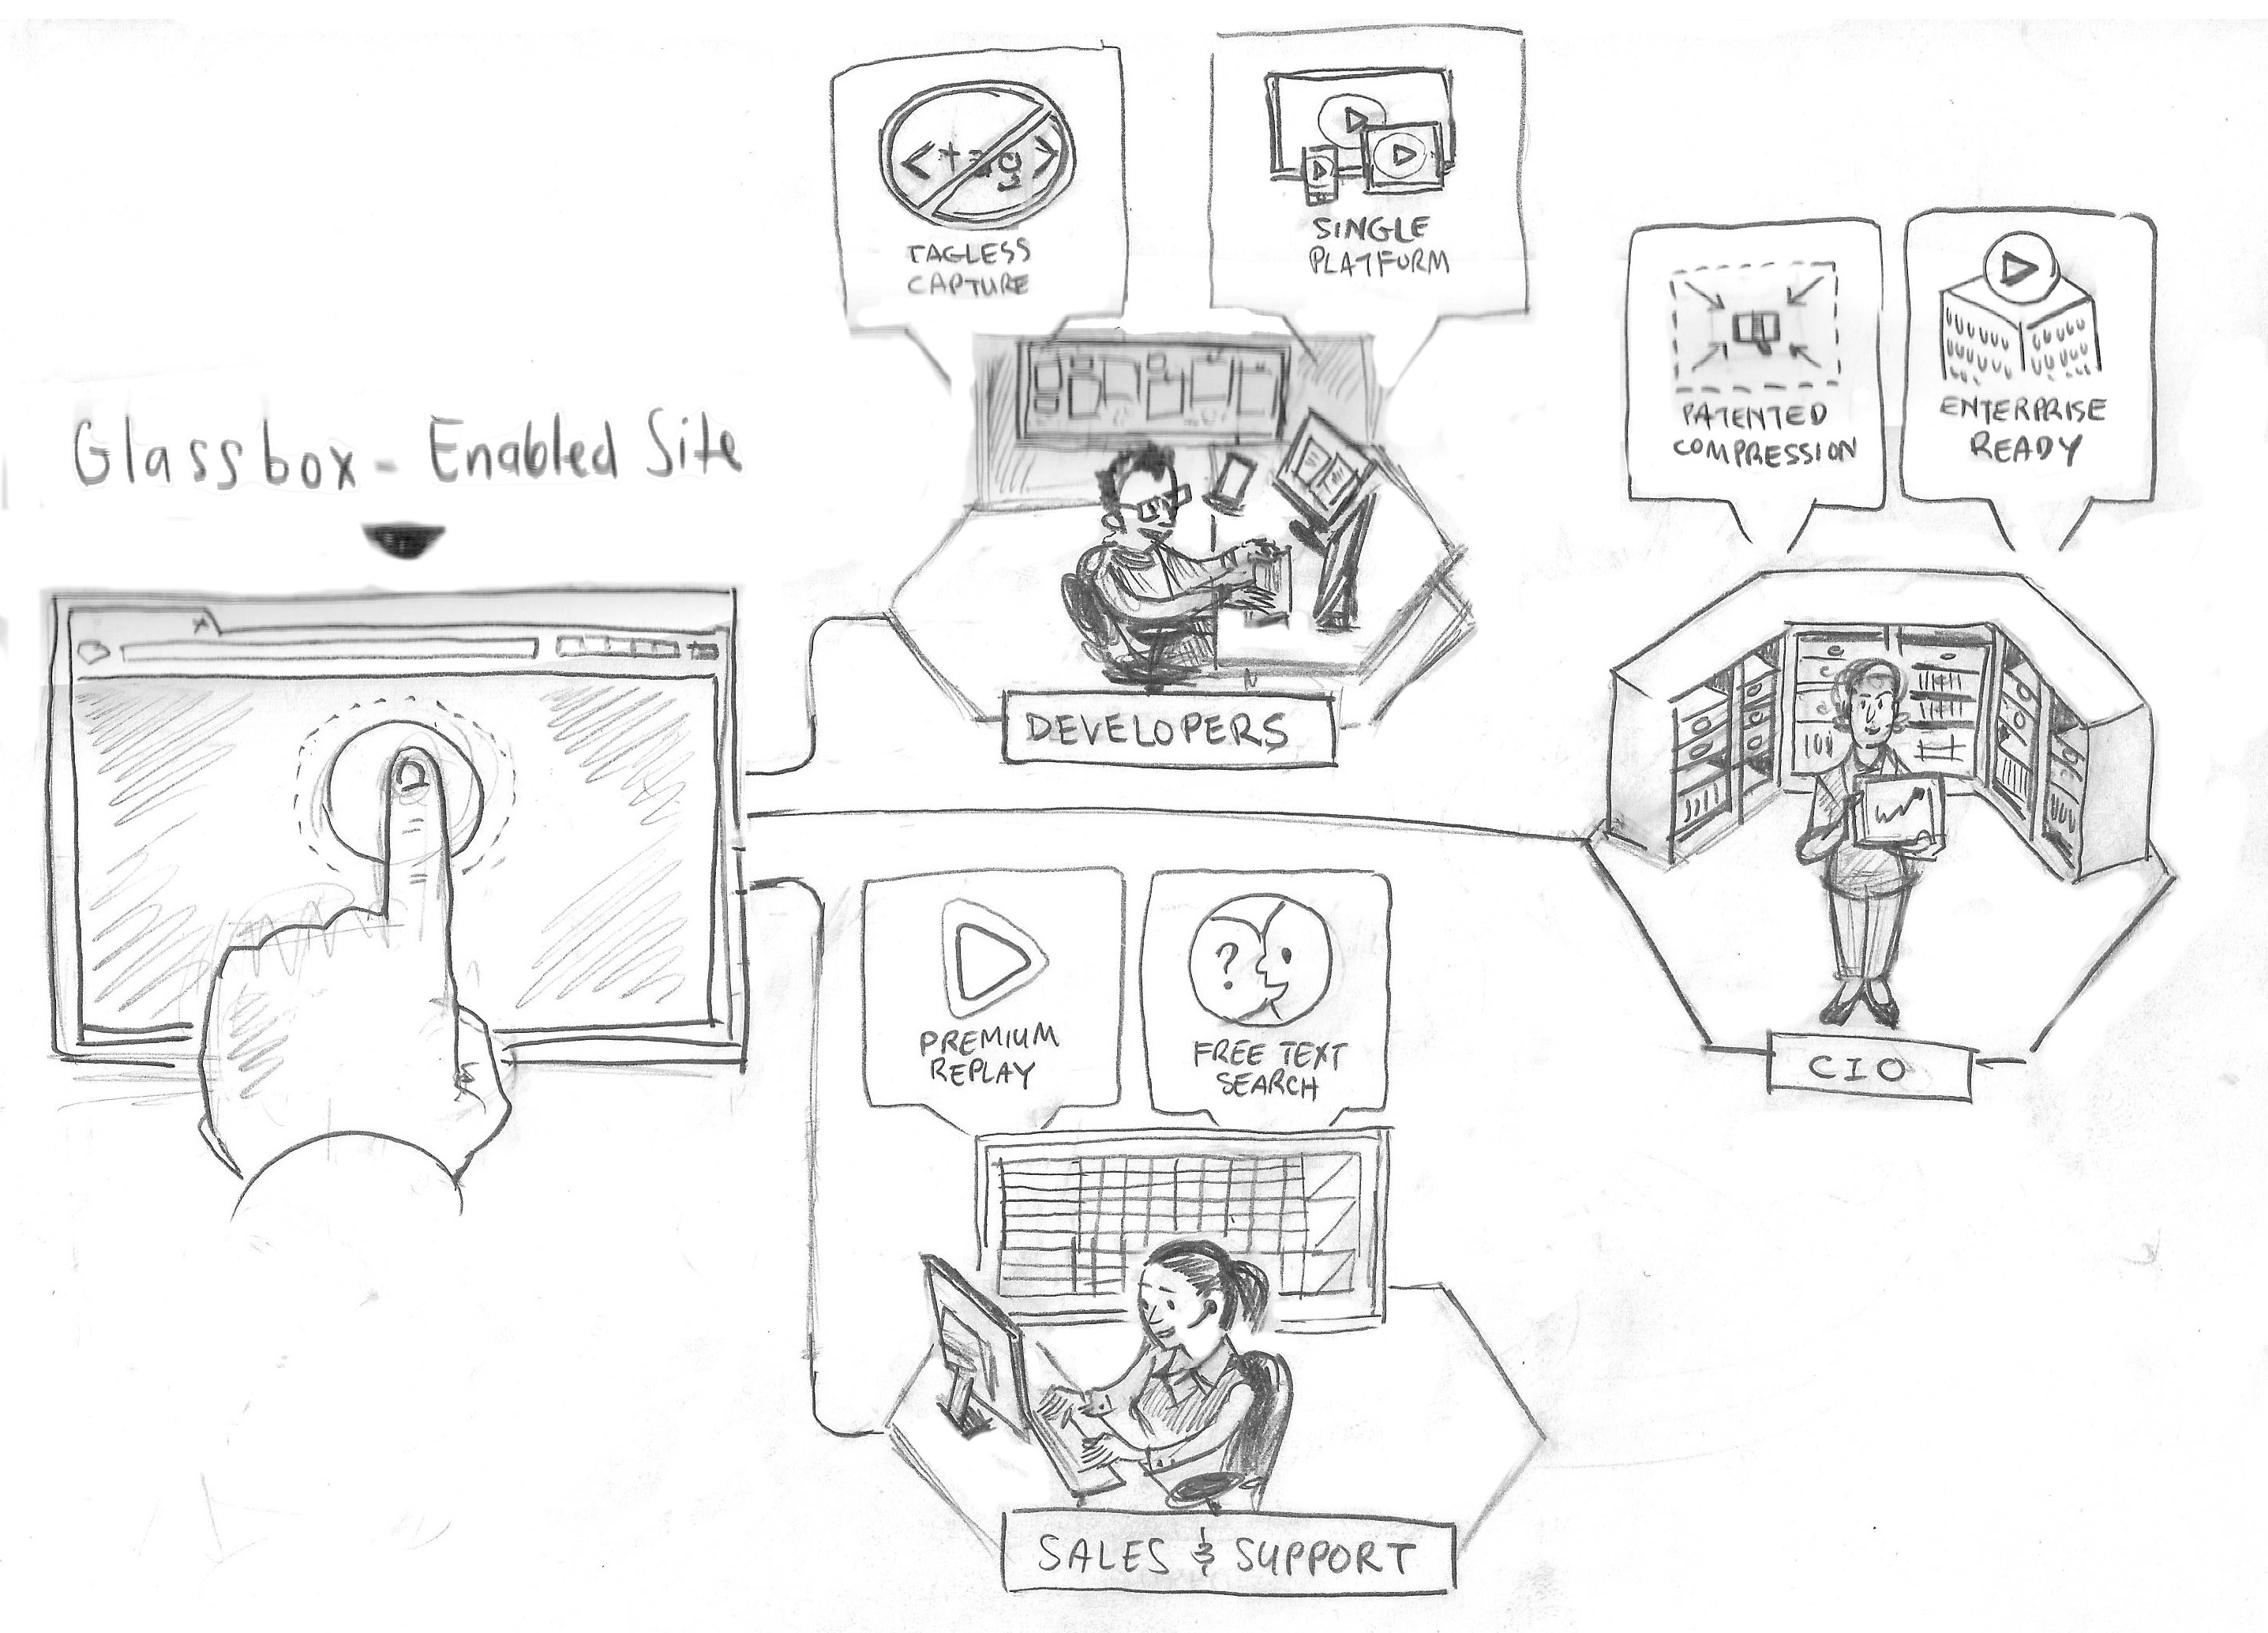
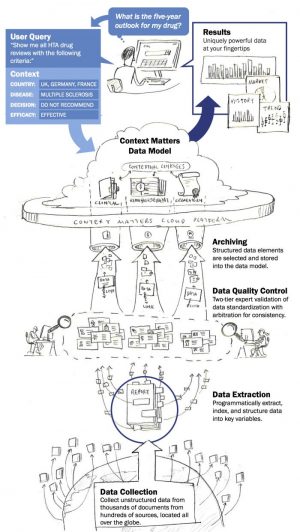
- Second, they allow the viewer to take in the whole concept in one image. This can be very helpful when trying to convey a complex system, concept, workflow, product, etc.
- Third, infographics can be repurposed, added to sales collateral or integrated into webinar presentations.
- Fourth, by displaying the infographic on a customized landing page, the image can function as a highly effective lead generation tool. For an instructive example, click here.
Developing Topics
The key to using infographics effectively is making them useful. How does one do that? Here are three creative “shortcuts” that produce excellent results.
- The first line of attack for a B2B is to survey the sales force. Ask reps what kinds of ideas they find themselves sketching out for a customer on a notepad or napkin. These are topics that customers care about that lend themselves to a visual explanation.
- Along the same lines, survey the customer service staff. What do customers have a hard time understanding — a return policy, a set of installation instructions, troubleshooting protocols? Here again a creative marketer can find subject matter for an infographic.
- Review existing content for text articles, slide presentations and video that can be converted into an infographic. Chances are, you’ve already created all the subject matter you need for a year’s worth of infographics.
Keep in mind that topics need not focus on your products and services; think about topics broadly as well. What industry issues are important to your customer base? What insights can you share on topics of general interest, such as sales skills, job interviewing techniques, etc?
Creative Considerations
Creating an inforgraphic requires close collaboration among designers, writers, marketing strategists and sometimes, subject matter experts and/or researchers. As with most visual content, infographics are neither cheap nor easy to produce.
If you find your infographic is turning out text-heavy, go back to the drawing board. The value of an infographic is effective visual communication; an idea that requires a lot of words to get across is better suited to a blog post or web page.
Know your audience. If you follow the topic development techniques mentioned earlier, you’ll be creating infographics for your customers and prospects — those people you know.
Sometimes, however, you may take another proven tack, pitching infographic ideas to popular blogs and websites in your niche. In this case, you will want to work with the publisher to get a grasp of their audience and what type of approach will create the most interest.
Don’t Dabble — Have a Plan
Producing a single infographic usually isn’t worth the effort, plus, it takes more than one attempt to evaluate how well infographics work for your business. Instead of dabbling, commit to one infographic per month or quarter; whatever your team can comfortably support.
You’re likely to experience a rapid learning curve on infographic development. Your fifth or sixth effort will be smoother than the first few — and probably achieve much better results.
From the article How to Use Infographics in B2B | B2B Insights Blog by Brad Shor.


